
Advertisement
What Kind Of Investor Owns Most Of HIVE Blockchain Technologies Ltd. (CVE:HIVE)?

If you want to know who really controls HIVE Blockchain Technologies Ltd. (CVE:HIVE), then you'll have to look at the makeup of its share registry. Large companies usually have institutions as shareholders, and we usually see insiders owning shares in smaller companies. Companies that have been privatized tend to have low insider ownership.
With a market capitalization of CA$47m, HIVE Blockchain Technologies is a small cap stock, so it might not be well known by many institutional investors. Our analysis of the ownership of the company, below, shows that institutional investors have bought into the company. Let's take a closer look to see what the different types of shareholder can tell us about HIVE.
See our latest analysis for HIVE Blockchain Technologies

What Does The Institutional Ownership Tell Us About HIVE Blockchain Technologies?
Many institutions measure their performance against an index that approximates the local market. So they usually pay more attention to companies that are included in major indices.
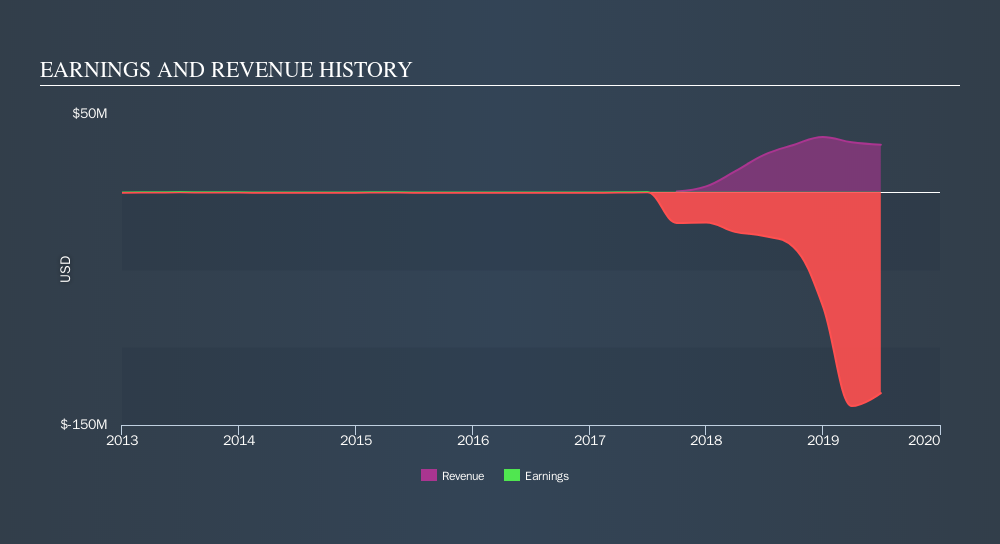
As you can see, institutional investors own 11% of HIVE Blockchain Technologies. This suggests some credibility amongst professional investors. But we can't rely on that fact alone, since institutions make bad investments sometimes, just like everyone does. When multiple institutions own a stock, there's always a risk that they are in a 'crowded trade'. When such a trade goes wrong, multiple parties may compete to sell stock fast. This risk is higher in a company without a history of growth. You can see HIVE Blockchain Technologies's historic earnings and revenue, below, but keep in mind there's always more to the story.
Hedge funds don't have many shares in HIVE Blockchain Technologies. There is a little analyst coverage of the stock, but not much. So there is room for it to gain more coverage.
Insider Ownership Of HIVE Blockchain Technologies
While the precise definition of an insider can be subjective, almost everyone considers board members to be insiders. The company management answer to the board; and the latter should represent the interests of shareholders. Notably, sometimes top-level managers are on the board, themselves.
Insider ownership is positive when it signals leadership are thinking like the true owners of the company. However, high insider ownership can also give immense power to a small group within the company. This can be negative in some circumstances.
We can see that insiders own shares in HIVE Blockchain Technologies Ltd.. As individuals, the insiders collectively own CA$580k worth of the CA$47m company. Some would say this shows alignment of interests between shareholders and the board, though I generally prefer to see bigger insider holdings. But it might be worth checking if those insiders have been selling.
General Public Ownership
The general public, who are mostly retail investors, collectively hold 71% of HIVE Blockchain Technologies shares. This size of ownership gives retail investors collective power. They can and probably do influence decisions on executive compensation, dividend policies and proposed business acquisitions.
Private Company Ownership
We can see that Private Companies own 17%, of the shares on issue. It's hard to draw any conclusions from this fact alone, so its worth looking into who owns those private companies. Sometimes insiders or other related parties have an interest in shares in a public company through a separate private company.
Next Steps:
While it is well worth considering the different groups that own a company, there are other factors that are even more important.
I always like to check for a history of revenue growth. You can too, by accessing this free chart of historic revenue and earnings in this detailed graph.
If you would prefer discover what analysts are predicting in terms of future growth, do not miss this free report on analyst forecasts.
NB: Figures in this article are calculated using data from the last twelve months, which refer to the 12-month period ending on the last date of the month the financial statement is dated. This may not be consistent with full year annual report figures.
We aim to bring you long-term focused research analysis driven by fundamental data. Note that our analysis may not factor in the latest price-sensitive company announcements or qualitative material.
If you spot an error that warrants correction, please contact the editor at editorial-team@simplywallst.com. This article by Simply Wall St is general in nature. It does not constitute a recommendation to buy or sell any stock, and does not take account of your objectives, or your financial situation. Simply Wall St has no position in the stocks mentioned. Thank you for reading.
About TSXV:HIVE
HIVE Digital Technologies
A technology company, engages in the building and operating data centers powered by green energy in Canada, Sweden, Iceland, Switzerland, and Paraguay.
High growth potential with adequate balance sheet.
Similar Companies
Market Insights


Advertisement
Community Narratives
For the Emperor: Why Games Workshop Could Be a Star Investment
Fair Value UK£160.00|0.4% undervalued
RO
Community Contributor
Securitas will boost margins with AI and tech-driven services
Fair Value SEK 260.91|45.0% undervalued
UN
Community Contributor
A Leader in EV Charging with Growth Potential
Fair Value €27.00|20.4% undervalued
TI
Community Contributor