Sylogist Ltd.'s (TSE:SYZ) On An Uptrend But Financial Prospects Look Pretty Weak: Is The Stock Overpriced?


Sylogist's (TSE:SYZ) stock is up by a considerable 19% over the past three months. However, in this article, we decided to focus on its weak fundamentals, as long-term financial performance of a business is what ultimately dictates market outcomes. In this article, we decided to focus on Sylogist's ROE.
Return on equity or ROE is a key measure used to assess how efficiently a company's management is utilizing the company's capital. Put another way, it reveals the company's success at turning shareholder investments into profits.
View our latest analysis for Sylogist
How Do You Calculate Return On Equity?
ROE can be calculated by using the formula:
Return on Equity = Net Profit (from continuing operations) ÷ Shareholders' Equity
So, based on the above formula, the ROE for Sylogist is:
1.3% = CA$485k ÷ CA$37m (Based on the trailing twelve months to March 2024).
The 'return' is the amount earned after tax over the last twelve months. That means that for every CA$1 worth of shareholders' equity, the company generated CA$0.01 in profit.
What Is The Relationship Between ROE And Earnings Growth?
Thus far, we have learned that ROE measures how efficiently a company is generating its profits. Depending on how much of these profits the company reinvests or "retains", and how effectively it does so, we are then able to assess a company’s earnings growth potential. Assuming everything else remains unchanged, the higher the ROE and profit retention, the higher the growth rate of a company compared to companies that don't necessarily bear these characteristics.
Sylogist's Earnings Growth And 1.3% ROE
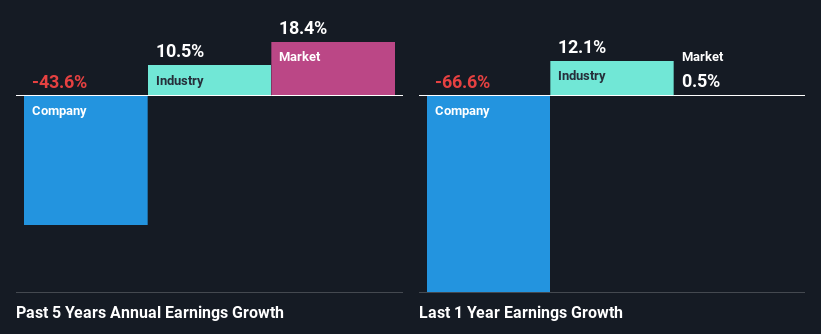
It is hard to argue that Sylogist's ROE is much good in and of itself. Even compared to the average industry ROE of 11%, the company's ROE is quite dismal. For this reason, Sylogist's five year net income decline of 44% is not surprising given its lower ROE. We reckon that there could also be other factors at play here. For example, the business has allocated capital poorly, or that the company has a very high payout ratio.
That being said, we compared Sylogist's performance with the industry and were concerned when we found that while the company has shrunk its earnings, the industry has grown its earnings at a rate of 10% in the same 5-year period.
Earnings growth is an important metric to consider when valuing a stock. It’s important for an investor to know whether the market has priced in the company's expected earnings growth (or decline). Doing so will help them establish if the stock's future looks promising or ominous. If you're wondering about Sylogist's's valuation, check out this gauge of its price-to-earnings ratio, as compared to its industry.
Is Sylogist Making Efficient Use Of Its Profits?
Sylogist's high three-year median payout ratio of 416% suggests that the company is depleting its resources to keep up its dividend payments, and this shows in its shrinking earnings. Paying a dividend beyond their means is usually not viable over the long term. You can see the 2 risks we have identified for Sylogist by visiting our risks dashboard for free on our platform here.
Moreover, Sylogist has been paying dividends for at least ten years or more suggesting that management must have perceived that the shareholders prefer dividends over earnings growth.
Summary
In total, we would have a hard think before deciding on any investment action concerning Sylogist. Specifically, it has shown quite an unsatisfactory performance as far as earnings growth is concerned, and a poor ROE and an equally poor rate of reinvestment seem to be the reason behind this inadequate performance. With that said, we studied the latest analyst forecasts and found that while the company has shrunk its earnings in the past, analysts expect its earnings to grow in the future. To know more about the company's future earnings growth forecasts take a look at this free report on analyst forecasts for the company to find out more.
If you're looking to trade Sylogist, open an account with the lowest-cost platform trusted by professionals, Interactive Brokers.
With clients in over 200 countries and territories, and access to 160 markets, IBKR lets you trade stocks, options, futures, forex, bonds and funds from a single integrated account.
Enjoy no hidden fees, no account minimums, and FX conversion rates as low as 0.03%, far better than what most brokers offer.
Sponsored ContentNew: Manage All Your Stock Portfolios in One Place
We've created the ultimate portfolio companion for stock investors, and it's free.
• Connect an unlimited number of Portfolios and see your total in one currency
• Be alerted to new Warning Signs or Risks via email or mobile
• Track the Fair Value of your stocks
Have feedback on this article? Concerned about the content? Get in touch with us directly. Alternatively, email editorial-team (at) simplywallst.com.
This article by Simply Wall St is general in nature. We provide commentary based on historical data and analyst forecasts only using an unbiased methodology and our articles are not intended to be financial advice. It does not constitute a recommendation to buy or sell any stock, and does not take account of your objectives, or your financial situation. We aim to bring you long-term focused analysis driven by fundamental data. Note that our analysis may not factor in the latest price-sensitive company announcements or qualitative material. Simply Wall St has no position in any stocks mentioned.
About TSX:SYZ
Sylogist
A software company, provides mission-critical software-as-a-service solutions to public sector customers in Canada, the United States, the United Kingdom, and internationally.
Reasonable growth potential with mediocre balance sheet.
Similar Companies
Market Insights

Community Narratives

