
Advertisement

Want to participate in a short research study? Help shape the future of investing tools and you could win a $250 gift card!
A look at the shareholders of NexTech AR Solutions Corp. (CNSX:NTAR) can tell us which group is most powerful. Large companies usually have institutions as shareholders, and we usually see insiders owning shares in smaller companies. Warren Buffett said that he likes 'a business with enduring competitive advantages that is run by able and owner-oriented people'. So it's nice to see some insider ownership, because it may suggest that management is owner-oriented.
With a market capitalization of CA$39m, NexTech AR Solutions is a small cap stock, so it might not be well known by many institutional investors. Our analysis of the ownership of the company, below, shows that institutions own shares in the company. We can zoom in on the different ownership groups, to learn more about NTAR.
Check out our latest analysis for NexTech AR Solutions
What Does The Institutional Ownership Tell Us About NexTech AR Solutions?
Institutional investors commonly compare their own returns to the returns of a commonly followed index. So they generally do consider buying larger companies that are included in the relevant benchmark index.
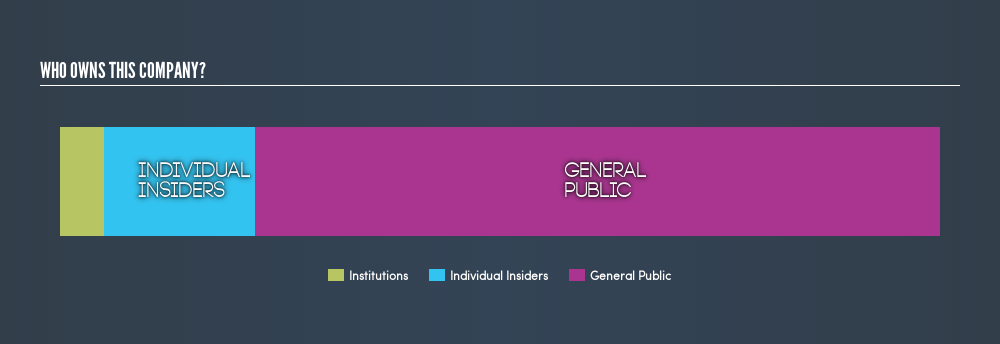
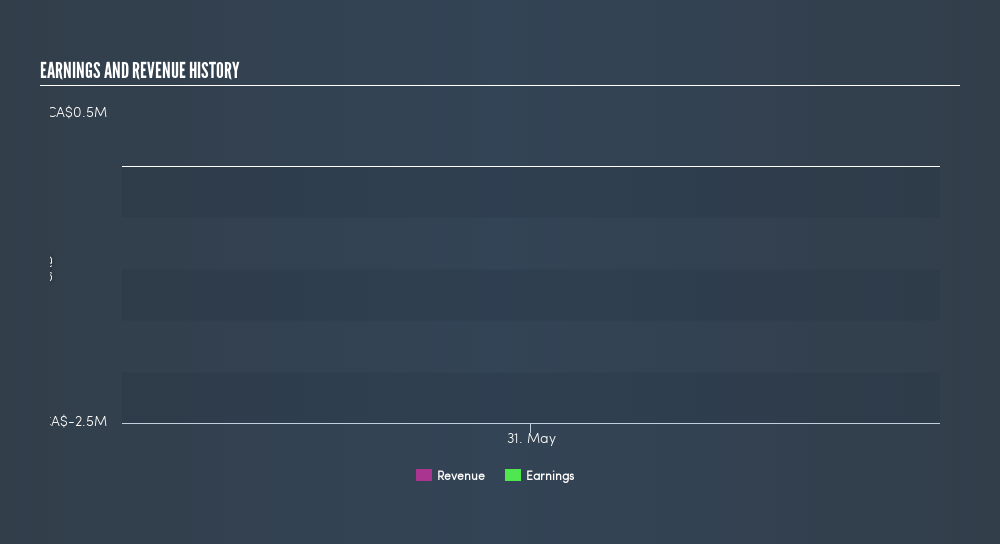
As you can see, institutional investors own 5.1% of NexTech AR Solutions. This can indicate that the company has a certain degree of credibility in the investment community. However, it is best to be wary of relying on the supposed validation that comes with institutional investors. They too, get it wrong sometimes. If multiple institutions change their view on a stock at the same time, you could see the share price drop fast. It's therefore worth looking at NexTech AR Solutions's earnings history, below. Of course, the future is what really matters.
We note that hedge funds don't have a meaningful investment in NexTech AR Solutions. As far I can tell there isn't analyst coverage of the company, so it is probably flying under the radar.
Insider Ownership Of NexTech AR Solutions
The definition of company insiders can be subjective, and does vary between jurisdictions. Our data reflects individual insiders, capturing board members at the very least. The company management answer to the board; and the latter should represent the interests of shareholders. Notably, sometimes top-level managers are on the board, themselves.
Insider ownership is positive when it signals leadership are thinking like the true owners of the company. However, high insider ownership can also give immense power to a small group within the company. This can be negative in some circumstances.
It seems insiders own a significant proportion of NexTech AR Solutions Corp.. It has a market capitalization of just CA$39m, and insiders have CA$6.7m worth of shares in their own names. I would say this shows alignment with shareholders, but it is worth noting that the company is still quite small; some insiders may have founded the business. You can click here to see if those insiders have been buying or selling.
General Public Ownership
The general public, mostly retail investors, hold a substantial 78% stake in NTAR, suggesting it is a fairly popular stock. With this size of ownership, retail investors can collectively play a role in decisions that affect shareholder returns, such as dividend policies and the appointment of directors. They can also exercise the power to decline an acquisition or merger that may not improve profitability.
Next Steps:
I find it very interesting to look at who exactly owns a company. But to truly gain insight, we need to consider other information, too.
I always like to check for a history of revenue growth. You can too, by accessing this free chart of historic revenue and earnings in this detailed graph.
If you would prefer check out another company -- one with potentially superior financials -- then do not miss this free list of interesting companies, backed by strong financial data.
NB: Figures in this article are calculated using data from the last twelve months, which refer to the 12-month period ending on the last date of the month the financial statement is dated. This may not be consistent with full year annual report figures.
We aim to bring you long-term focused research analysis driven by fundamental data. Note that our analysis may not factor in the latest price-sensitive company announcements or qualitative material.
If you spot an error that warrants correction, please contact the editor at editorial-team@simplywallst.com. This article by Simply Wall St is general in nature. It does not constitute a recommendation to buy or sell any stock, and does not take account of your objectives, or your financial situation. Simply Wall St has no position in the stocks mentioned. Thank you for reading.
Market Insights


Advertisement
Community Narratives
For the Emperor: Why Games Workshop Could Be a Star Investment
Fair Value UK£160.00|0.4% overvalued
RO
Community Contributor
Securitas will boost margins with AI and tech-driven services
Fair Value SEK 260.91|44.5% undervalued
UN
Community Contributor
A Leader in EV Charging with Growth Potential
Fair Value €27.00|17.8% undervalued
TI
Community Contributor