- Canada
- /
- Specialty Stores
- /
- TSXV:BILD
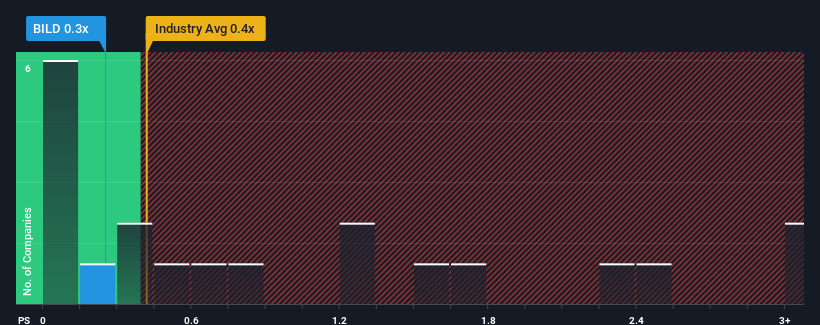
Lacklustre Performance Is Driving BuildDirect.com Technologies Inc.'s (CVE:BILD) Low P/S

When you see that almost half of the companies in the Specialty Retail industry in Canada have price-to-sales ratios (or "P/S") above 1.3x, BuildDirect.com Technologies Inc. (CVE:BILD) looks to be giving off some buy signals with its 0.3x P/S ratio. Although, it's not wise to just take the P/S at face value as there may be an explanation why it's limited.
See our latest analysis for BuildDirect.com Technologies
How Has BuildDirect.com Technologies Performed Recently?
BuildDirect.com Technologies hasn't been tracking well recently as its declining revenue compares poorly to other companies, which have seen some growth in their revenues on average. The P/S ratio is probably low because investors think this poor revenue performance isn't going to get any better. So while you could say the stock is cheap, investors will be looking for improvement before they see it as good value.
Keen to find out how analysts think BuildDirect.com Technologies' future stacks up against the industry? In that case, our free report is a great place to start.How Is BuildDirect.com Technologies' Revenue Growth Trending?
BuildDirect.com Technologies' P/S ratio would be typical for a company that's only expected to deliver limited growth, and importantly, perform worse than the industry.
Taking a look back first, the company's revenue growth last year wasn't something to get excited about as it posted a disappointing decline of 17%. The last three years don't look nice either as the company has shrunk revenue by 9.5% in aggregate. Accordingly, shareholders would have felt downbeat about the medium-term rates of revenue growth.
Looking ahead now, revenue is anticipated to slump, contracting by 8.6% during the coming year according to the one analyst following the company. That's not great when the rest of the industry is expected to grow by 9.2%.
With this in consideration, we find it intriguing that BuildDirect.com Technologies' P/S is closely matching its industry peers. However, shrinking revenues are unlikely to lead to a stable P/S over the longer term. There's potential for the P/S to fall to even lower levels if the company doesn't improve its top-line growth.
The Key Takeaway
Using the price-to-sales ratio alone to determine if you should sell your stock isn't sensible, however it can be a practical guide to the company's future prospects.
As we suspected, our examination of BuildDirect.com Technologies' analyst forecasts revealed that its outlook for shrinking revenue is contributing to its low P/S. As other companies in the industry are forecasting revenue growth, BuildDirect.com Technologies' poor outlook justifies its low P/S ratio. Unless there's material change, it's hard to envision a situation where the stock price will rise drastically.
It is also worth noting that we have found 2 warning signs for BuildDirect.com Technologies (1 can't be ignored!) that you need to take into consideration.
If companies with solid past earnings growth is up your alley, you may wish to see this free collection of other companies with strong earnings growth and low P/E ratios.
The New Payments ETF Is Live on NASDAQ:
Money is moving to real-time rails, and a newly listed ETF now gives investors direct exposure. Fast settlement. Institutional custody. Simple access.
Explore how this launch could reshape portfolios
Sponsored ContentValuation is complex, but we're here to simplify it.
Discover if BuildDirect.com Technologies might be undervalued or overvalued with our detailed analysis, featuring fair value estimates, potential risks, dividends, insider trades, and its financial condition.
Access Free AnalysisHave feedback on this article? Concerned about the content? Get in touch with us directly. Alternatively, email editorial-team (at) simplywallst.com.
This article by Simply Wall St is general in nature. We provide commentary based on historical data and analyst forecasts only using an unbiased methodology and our articles are not intended to be financial advice. It does not constitute a recommendation to buy or sell any stock, and does not take account of your objectives, or your financial situation. We aim to bring you long-term focused analysis driven by fundamental data. Note that our analysis may not factor in the latest price-sensitive company announcements or qualitative material. Simply Wall St has no position in any stocks mentioned.
About TSXV:BILD
BuildDirect.com Technologies
Operates a marketplace for purchasing and selling building materials online in the United States, Canada, and internationally.
Excellent balance sheet with minimal risk.
Similar Companies
Market Insights

Weekly Picks

Early mover in a fast growing industry. Likely to experience share price volatility as they scale


A case for CA$31.80 (undiluted), aka 8,616% upside from CA$0.37 (an 86 bagger!).


Moderation and Stabilisation: HOLD: Fair Price based on a 4-year Cycle is $12.08
Recently Updated Narratives


Title: Market Sentiment Is Dead Wrong — Here's Why PSEC Deserves a Second Look


An amazing opportunity to potentially get a 100 bagger

Amazon: Why the World’s Biggest Platform Still Runs on Invisible Economics
Popular Narratives


MicroVision will explode future revenue by 380.37% with a vision towards success


Crazy Undervalued 42 Baggers Silver Play (Active & Running Mine)


NVDA: Expanding AI Demand Will Drive Major Data Center Investments Through 2026
Trending Discussion
