
Advertisement
- Canada
- /
- Real Estate
- /
- TSX:TCN
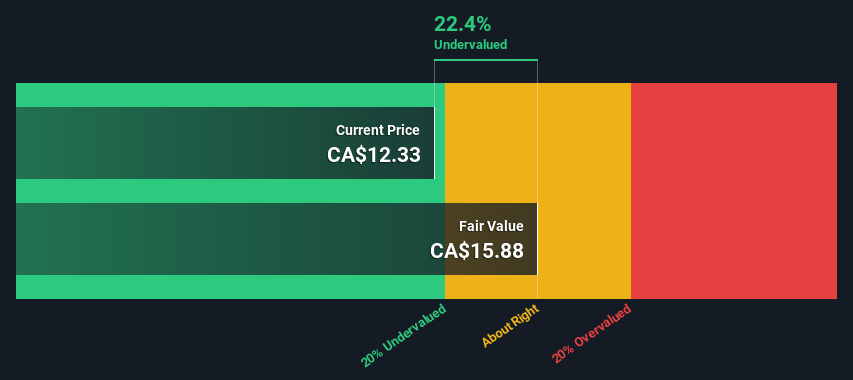
Tricon Residential Inc. (TSE:TCN) Shares Could Be 22% Below Their Intrinsic Value Estimate
Key Insights
- Using the 2 Stage Free Cash Flow to Equity, Tricon Residential fair value estimate is CA$15.88
- Tricon Residential's CA$12.33 share price signals that it might be 22% undervalued
- Our fair value estimate is 21% higher than Tricon Residential's analyst price target of US$13.11
In this article we are going to estimate the intrinsic value of Tricon Residential Inc. (TSE:TCN) by taking the expected future cash flows and discounting them to their present value. Our analysis will employ the Discounted Cash Flow (DCF) model. It may sound complicated, but actually it is quite simple!
Companies can be valued in a lot of ways, so we would point out that a DCF is not perfect for every situation. If you still have some burning questions about this type of valuation, take a look at the Simply Wall St analysis model.
View our latest analysis for Tricon Residential
Is Tricon Residential Fairly Valued?
We use what is known as a 2-stage model, which simply means we have two different periods of growth rates for the company's cash flows. Generally the first stage is higher growth, and the second stage is a lower growth phase. To begin with, we have to get estimates of the next ten years of cash flows. Seeing as no analyst estimates of free cash flow are available to us, we have extrapolate the previous free cash flow (FCF) from the company's last reported value. We assume companies with shrinking free cash flow will slow their rate of shrinkage, and that companies with growing free cash flow will see their growth rate slow, over this period. We do this to reflect that growth tends to slow more in the early years than it does in later years.
Generally we assume that a dollar today is more valuable than a dollar in the future, and so the sum of these future cash flows is then discounted to today's value:
10-year free cash flow (FCF) estimate
| 2024 | 2025 | 2026 | 2027 | 2028 | 2029 | 2030 | 2031 | 2032 | 2033 | |
| Levered FCF ($, Millions) | US$263.6m | US$313.6m | US$356.9m | US$393.4m | US$423.6m | US$448.7m | US$469.7m | US$487.7m | US$503.3m | US$517.4m |
| Growth Rate Estimate Source | Est @ 26.32% | Est @ 18.97% | Est @ 13.82% | Est @ 10.21% | Est @ 7.69% | Est @ 5.92% | Est @ 4.69% | Est @ 3.82% | Est @ 3.21% | Est @ 2.79% |
| Present Value ($, Millions) Discounted @ 14% | US$232 | US$243 | US$243 | US$236 | US$223 | US$208 | US$191 | US$175 | US$159 | US$144 |
("Est" = FCF growth rate estimated by Simply Wall St)
Present Value of 10-year Cash Flow (PVCF) = US$2.1b
After calculating the present value of future cash flows in the initial 10-year period, we need to calculate the Terminal Value, which accounts for all future cash flows beyond the first stage. The Gordon Growth formula is used to calculate Terminal Value at a future annual growth rate equal to the 5-year average of the 10-year government bond yield of 1.8%. We discount the terminal cash flows to today's value at a cost of equity of 14%.
Terminal Value (TV)= FCF2033 × (1 + g) ÷ (r – g) = US$517m× (1 + 1.8%) ÷ (14%– 1.8%) = US$4.4b
Present Value of Terminal Value (PVTV)= TV / (1 + r)10= US$4.4b÷ ( 1 + 14%)10= US$1.2b
The total value is the sum of cash flows for the next ten years plus the discounted terminal value, which results in the Total Equity Value, which in this case is US$3.3b. To get the intrinsic value per share, we divide this by the total number of shares outstanding. Relative to the current share price of CA$12.3, the company appears a touch undervalued at a 22% discount to where the stock price trades currently. Remember though, that this is just an approximate valuation, and like any complex formula - garbage in, garbage out.
The Assumptions
We would point out that the most important inputs to a discounted cash flow are the discount rate and of course the actual cash flows. You don't have to agree with these inputs, I recommend redoing the calculations yourself and playing with them. The DCF also does not consider the possible cyclicality of an industry, or a company's future capital requirements, so it does not give a full picture of a company's potential performance. Given that we are looking at Tricon Residential as potential shareholders, the cost of equity is used as the discount rate, rather than the cost of capital (or weighted average cost of capital, WACC) which accounts for debt. In this calculation we've used 14%, which is based on a levered beta of 2.000. Beta is a measure of a stock's volatility, compared to the market as a whole. We get our beta from the industry average beta of globally comparable companies, with an imposed limit between 0.8 and 2.0, which is a reasonable range for a stable business.
SWOT Analysis for Tricon Residential
Strength
- Earnings growth over the past year exceeded the industry.
- Dividends are covered by earnings and cash flows.
Weakness
- Earnings growth over the past year is below its 5-year average.
- Interest payments on debt are not well covered.
- Dividend is low compared to the top 25% of dividend payers in the Real Estate market.
Opportunity
- Good value based on P/E ratio and estimated fair value.
Threat
- Debt is not well covered by operating cash flow.
- Annual earnings are forecast to decline for the next 3 years.
Next Steps:
Valuation is only one side of the coin in terms of building your investment thesis, and it shouldn't be the only metric you look at when researching a company. DCF models are not the be-all and end-all of investment valuation. Rather it should be seen as a guide to "what assumptions need to be true for this stock to be under/overvalued?" If a company grows at a different rate, or if its cost of equity or risk free rate changes sharply, the output can look very different. What is the reason for the share price sitting below the intrinsic value? For Tricon Residential, we've put together three essential factors you should further examine:
- Risks: Case in point, we've spotted 4 warning signs for Tricon Residential you should be aware of, and 2 of them don't sit too well with us.
- Future Earnings: How does TCN's growth rate compare to its peers and the wider market? Dig deeper into the analyst consensus number for the upcoming years by interacting with our free analyst growth expectation chart.
- Other Solid Businesses: Low debt, high returns on equity and good past performance are fundamental to a strong business. Why not explore our interactive list of stocks with solid business fundamentals to see if there are other companies you may not have considered!
PS. Simply Wall St updates its DCF calculation for every Canadian stock every day, so if you want to find the intrinsic value of any other stock just search here.
Valuation is complex, but we're here to simplify it.
Discover if Tricon Residential might be undervalued or overvalued with our detailed analysis, featuring fair value estimates, potential risks, dividends, insider trades, and its financial condition.
Access Free AnalysisHave feedback on this article? Concerned about the content? Get in touch with us directly. Alternatively, email editorial-team (at) simplywallst.com.
This article by Simply Wall St is general in nature. We provide commentary based on historical data and analyst forecasts only using an unbiased methodology and our articles are not intended to be financial advice. It does not constitute a recommendation to buy or sell any stock, and does not take account of your objectives, or your financial situation. We aim to bring you long-term focused analysis driven by fundamental data. Note that our analysis may not factor in the latest price-sensitive company announcements or qualitative material. Simply Wall St has no position in any stocks mentioned.
About TSX:TCN
Tricon Residential
Tricon Residential Inc. (NYSE: TCN, TSX: TCN) is an owner, operator and developer of a growing portfolio of approximately 38,000 single-family rental homes in the U.S.
Average dividend payer and slightly overvalued.
Market Insights

Advertisement
Community Narratives
MINISO's fair value is projected at 26.69 with an anticipated PE ratio shift of 20x
Fair Value US$24.03|11.0% undervalued
BE
Community Contributor
Procter & Gamble: A Dividend Giant Facing Slowing Growth
Fair Value US$119.81|23.3% overvalued
AN
Community Contributor
Eli Lilly's Future Growth Driven by Tirzepatide and Favorable Market Conditions
Fair Value US$1.19k|13.8% undervalued
EA
Community Contributor