
Advertisement
Does The Market Have A Low Tolerance For Vext Science, Inc.'s (CSE:VEXT) Mixed Fundamentals?

Vext Science (CSE:VEXT) has had a rough three months with its share price down 24%. It is possible that the markets have ignored the company's differing financials and decided to lean-in to the negative sentiment. Fundamentals usually dictate market outcomes so it makes sense to study the company's financials. Specifically, we decided to study Vext Science's ROE in this article.
Return on equity or ROE is a key measure used to assess how efficiently a company's management is utilizing the company's capital. In simpler terms, it measures the profitability of a company in relation to shareholder's equity.
Check out our latest analysis for Vext Science
How To Calculate Return On Equity?
Return on equity can be calculated by using the formula:
Return on Equity = Net Profit (from continuing operations) ÷ Shareholders' Equity
So, based on the above formula, the ROE for Vext Science is:
8.7% = US$5.0m ÷ US$58m (Based on the trailing twelve months to September 2021).
The 'return' is the income the business earned over the last year. One way to conceptualize this is that for each CA$1 of shareholders' capital it has, the company made CA$0.09 in profit.
Why Is ROE Important For Earnings Growth?
Thus far, we have learned that ROE measures how efficiently a company is generating its profits. Based on how much of its profits the company chooses to reinvest or "retain", we are then able to evaluate a company's future ability to generate profits. Assuming everything else remains unchanged, the higher the ROE and profit retention, the higher the growth rate of a company compared to companies that don't necessarily bear these characteristics.
Vext Science's Earnings Growth And 8.7% ROE
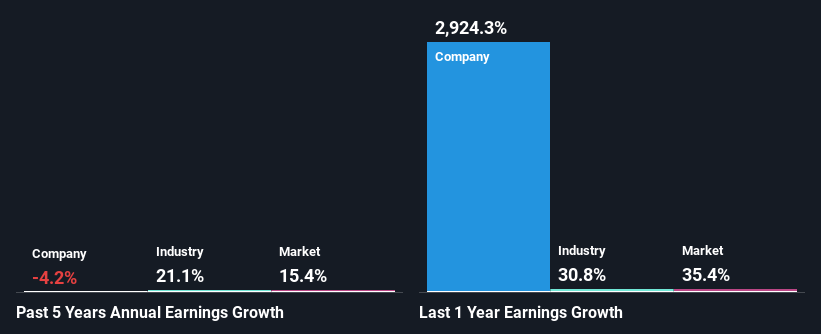
At first glance, Vext Science's ROE doesn't look very promising. We then compared the company's ROE to the broader industry and were disappointed to see that the ROE is lower than the industry average of 13%. Given the circumstances, the significant decline in net income by 4.2% seen by Vext Science over the last five years is not surprising. We reckon that there could also be other factors at play here. For instance, the company has a very high payout ratio, or is faced with competitive pressures.
That being said, we compared Vext Science's performance with the industry and were concerned when we found that while the company has shrunk its earnings, the industry has grown its earnings at a rate of 21% in the same period.
Earnings growth is a huge factor in stock valuation. It’s important for an investor to know whether the market has priced in the company's expected earnings growth (or decline). By doing so, they will have an idea if the stock is headed into clear blue waters or if swampy waters await. If you're wondering about Vext Science's's valuation, check out this gauge of its price-to-earnings ratio, as compared to its industry.
Is Vext Science Using Its Retained Earnings Effectively?
Because Vext Science doesn't pay any dividends, we infer that it is retaining all of its profits, which is rather perplexing when you consider the fact that there is no earnings growth to show for it. It looks like there might be some other reasons to explain the lack in that respect. For example, the business could be in decline.
Summary
On the whole, we feel that the performance shown by Vext Science can be open to many interpretations. While the company does have a high rate of profit retention, its low rate of return is probably hampering its earnings growth. Wrapping up, we would proceed with caution with this company and one way of doing that would be to look at the risk profile of the business. Our risks dashboard would have the 5 risks we have identified for Vext Science.
New: Manage All Your Stock Portfolios in One Place
We've created the ultimate portfolio companion for stock investors, and it's free.
• Connect an unlimited number of Portfolios and see your total in one currency
• Be alerted to new Warning Signs or Risks via email or mobile
• Track the Fair Value of your stocks
Have feedback on this article? Concerned about the content? Get in touch with us directly. Alternatively, email editorial-team (at) simplywallst.com.
This article by Simply Wall St is general in nature. We provide commentary based on historical data and analyst forecasts only using an unbiased methodology and our articles are not intended to be financial advice. It does not constitute a recommendation to buy or sell any stock, and does not take account of your objectives, or your financial situation. We aim to bring you long-term focused analysis driven by fundamental data. Note that our analysis may not factor in the latest price-sensitive company announcements or qualitative material. Simply Wall St has no position in any stocks mentioned.
About CNSX:VEXT
Vext Science
Through its subsidiaries, provides integrated agricultural technology, services, and property management services in the cannabis industry in the United States.
Undervalued low.
Similar Companies
Market Insights

Advertisement
Community Narratives
Groundbreaking therapies that could change the treatment landscape for PTSD, fibromyalgia, MS & Alzheimer’s
Fair Value US$6.20|86.9% undervalued
CM
Community Contributor
DigitalOcean Will Grow 14% by Embracing AI with Paperspace Acquisition
Fair Value US$50.00|40.2% undervalued
NE
Community Contributor
Viant Technology: A Rising AdTech Challenger in the AI-Powered CTV Market
Fair Value US$38.61|62.7% undervalued
BL
Community Contributor
Volvo will Accelerate Forward into Electric and Autonomous Leadership in Five Years
Fair Value SEK 438.80|40.1% undervalued
UN
Community Contributor