
Advertisement
- Canada
- /
- Entertainment
- /
- TSXV:ESE
Investors Still Aren't Entirely Convinced By ESE Entertainment Inc.'s (CVE:ESE) Revenues Despite 50% Price Jump
ESE Entertainment Inc. (CVE:ESE) shareholders would be excited to see that the share price has had a great month, posting a 50% gain and recovering from prior weakness. Still, the 30-day jump doesn't change the fact that longer term shareholders have seen their stock decimated by the 55% share price drop in the last twelve months.
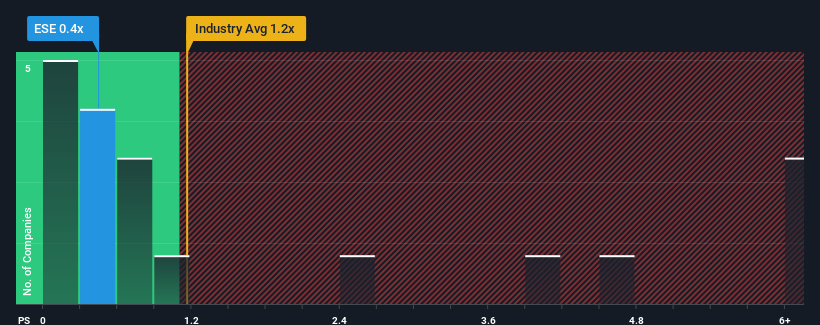
In spite of the firm bounce in price, it's still not a stretch to say that ESE Entertainment's price-to-sales (or "P/S") ratio of 0.4x right now seems quite "middle-of-the-road" compared to the Entertainment industry in Canada, where the median P/S ratio is around 0.6x. However, investors might be overlooking a clear opportunity or potential setback if there is no rational basis for the P/S.
View our latest analysis for ESE Entertainment
What Does ESE Entertainment's P/S Mean For Shareholders?
For example, consider that ESE Entertainment's financial performance has been poor lately as its revenue has been in decline. Perhaps investors believe the recent revenue performance is enough to keep in line with the industry, which is keeping the P/S from dropping off. If you like the company, you'd at least be hoping this is the case so that you could potentially pick up some stock while it's not quite in favour.
Want the full picture on earnings, revenue and cash flow for the company? Then our free report on ESE Entertainment will help you shine a light on its historical performance.What Are Revenue Growth Metrics Telling Us About The P/S?
In order to justify its P/S ratio, ESE Entertainment would need to produce growth that's similar to the industry.
Taking a look back first, the company's revenue growth last year wasn't something to get excited about as it posted a disappointing decline of 68%. The latest three year period has seen an incredible overall rise in revenue, a stark contrast to the last 12 months. So while the company has done a great job in the past, it's somewhat concerning to see revenue growth decline so harshly.
Comparing that recent medium-term revenue trajectory with the industry's one-year growth forecast of 5.2% shows it's noticeably more attractive.
In light of this, it's curious that ESE Entertainment's P/S sits in line with the majority of other companies. Apparently some shareholders believe the recent performance is at its limits and have been accepting lower selling prices.
The Bottom Line On ESE Entertainment's P/S
Its shares have lifted substantially and now ESE Entertainment's P/S is back within range of the industry median. While the price-to-sales ratio shouldn't be the defining factor in whether you buy a stock or not, it's quite a capable barometer of revenue expectations.
To our surprise, ESE Entertainment revealed its three-year revenue trends aren't contributing to its P/S as much as we would have predicted, given they look better than current industry expectations. There could be some unobserved threats to revenue preventing the P/S ratio from matching this positive performance. At least the risk of a price drop looks to be subdued if recent medium-term revenue trends continue, but investors seem to think future revenue could see some volatility.
We don't want to rain on the parade too much, but we did also find 3 warning signs for ESE Entertainment that you need to be mindful of.
Of course, profitable companies with a history of great earnings growth are generally safer bets. So you may wish to see this free collection of other companies that have reasonable P/E ratios and have grown earnings strongly.
Valuation is complex, but we're here to simplify it.
Discover if ESE Entertainment might be undervalued or overvalued with our detailed analysis, featuring fair value estimates, potential risks, dividends, insider trades, and its financial condition.
Access Free AnalysisHave feedback on this article? Concerned about the content? Get in touch with us directly. Alternatively, email editorial-team (at) simplywallst.com.
This article by Simply Wall St is general in nature. We provide commentary based on historical data and analyst forecasts only using an unbiased methodology and our articles are not intended to be financial advice. It does not constitute a recommendation to buy or sell any stock, and does not take account of your objectives, or your financial situation. We aim to bring you long-term focused analysis driven by fundamental data. Note that our analysis may not factor in the latest price-sensitive company announcements or qualitative material. Simply Wall St has no position in any stocks mentioned.
About TSXV:ESE
ESE Entertainment
An entertainment company, focuses on gaming and esports in Canada and internationally.
Moderate risk with imperfect balance sheet.
Market Insights

Advertisement
Community Narratives
The company that turned a verb into a global necessity and basically runs the modern internet, digital ads, smartphones, maps, and AI.
Fair Value US$300.00|5.2% undervalued
OS
Community Contributor
Flowers Foods Pays A Fair Price For Health
Fair Value US$16.12|24.9% undervalued
NV
Community Contributor
TMX Group will thrive with 33.3% profit margin and enduring market moat
Fair Value CA$49.90|3.3% overvalued
LI
Community Contributor
The "Molecular Pencil": Why Beam's Technology is Built to Win
Fair Value US$65.01|64.5% undervalued
DA
Community Contributor