
Advertisement
- Canada
- /
- Metals and Mining
- /
- TSXV:THX
We Like These Underlying Return On Capital Trends At Thor Explorations (CVE:THX)

Did you know there are some financial metrics that can provide clues of a potential multi-bagger? Ideally, a business will show two trends; firstly a growing return on capital employed (ROCE) and secondly, an increasing amount of capital employed. Basically this means that a company has profitable initiatives that it can continue to reinvest in, which is a trait of a compounding machine. Speaking of which, we noticed some great changes in Thor Explorations' (CVE:THX) returns on capital, so let's have a look.
Understanding Return On Capital Employed (ROCE)
For those that aren't sure what ROCE is, it measures the amount of pre-tax profits a company can generate from the capital employed in its business. To calculate this metric for Thor Explorations, this is the formula:
Return on Capital Employed = Earnings Before Interest and Tax (EBIT) ÷ (Total Assets - Current Liabilities)
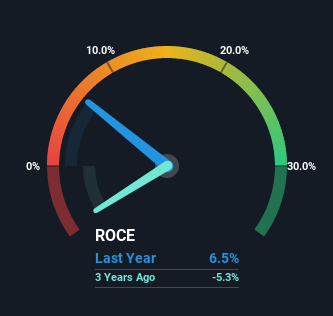
0.065 = US$8.3m ÷ (US$208m - US$81m) (Based on the trailing twelve months to June 2022).
Therefore, Thor Explorations has an ROCE of 6.5%. On its own that's a low return, but compared to the average of 3.6% generated by the Metals and Mining industry, it's much better.
Our analysis indicates that THX is potentially undervalued!
Above you can see how the current ROCE for Thor Explorations compares to its prior returns on capital, but there's only so much you can tell from the past. If you'd like to see what analysts are forecasting going forward, you should check out our free report for Thor Explorations.
What The Trend Of ROCE Can Tell Us
Thor Explorations has recently broken into profitability so their prior investments seem to be paying off. The company was generating losses five years ago, but now it's earning 6.5% which is a sight for sore eyes. And unsurprisingly, like most companies trying to break into the black, Thor Explorations is utilizing 365% more capital than it was five years ago. This can tell us that the company has plenty of reinvestment opportunities that are able to generate higher returns.
For the record though, there was a noticeable increase in the company's current liabilities over the period, so we would attribute some of the ROCE growth to that. The current liabilities has increased to 39% of total assets, so the business is now more funded by the likes of its suppliers or short-term creditors. Keep an eye out for future increases because when the ratio of current liabilities to total assets gets particularly high, this can introduce some new risks for the business.
In Conclusion...
In summary, it's great to see that Thor Explorations has managed to break into profitability and is continuing to reinvest in its business. Investors may not be impressed by the favorable underlying trends yet because over the last five years the stock has only returned 18% to shareholders. Given that, we'd look further into this stock in case it has more traits that could make it multiply in the long term.
On a separate note, we've found 1 warning sign for Thor Explorations you'll probably want to know about.
If you want to search for solid companies with great earnings, check out this free list of companies with good balance sheets and impressive returns on equity.
Valuation is complex, but we're here to simplify it.
Discover if Thor Explorations might be undervalued or overvalued with our detailed analysis, featuring fair value estimates, potential risks, dividends, insider trades, and its financial condition.
Access Free AnalysisHave feedback on this article? Concerned about the content? Get in touch with us directly. Alternatively, email editorial-team (at) simplywallst.com.
This article by Simply Wall St is general in nature. We provide commentary based on historical data and analyst forecasts only using an unbiased methodology and our articles are not intended to be financial advice. It does not constitute a recommendation to buy or sell any stock, and does not take account of your objectives, or your financial situation. We aim to bring you long-term focused analysis driven by fundamental data. Note that our analysis may not factor in the latest price-sensitive company announcements or qualitative material. Simply Wall St has no position in any stocks mentioned.
About TSXV:THX
Flawless balance sheet, undervalued and pays a dividend.
Similar Companies
Market Insights

Advertisement
Community Narratives
WhiteCap Is Positioned To Profit Regardless Of Trump's Policy 
Fair Value CA$22.60|61.6% undervalued
ST
Equity Analyst and Writer
Microsoft's Evolution Will Drive Revenue to New Heights Fueled by AI
Fair Value US$360.00|29.9% overvalued
BR
Community Contributor
A CASE FOR USD$2.50 (CAD$3.44) BY 2028 (A 5-10 BAGGER)
Fair Value CA$3.44|87.8% undervalued
AG
Community Contributor