- Canada
- /
- Metals and Mining
- /
- TSXV:PEX
We're Keeping An Eye On Pacific Ridge Exploration's (CVE:PEX) Cash Burn Rate
Just because a business does not make any money, does not mean that the stock will go down. For example, biotech and mining exploration companies often lose money for years before finding success with a new treatment or mineral discovery. But the harsh reality is that very many loss making companies burn through all their cash and go bankrupt.
So should Pacific Ridge Exploration (CVE:PEX) shareholders be worried about its cash burn? In this report, we will consider the company's annual negative free cash flow, henceforth referring to it as the 'cash burn'. First, we'll determine its cash runway by comparing its cash burn with its cash reserves.
Check out our latest analysis for Pacific Ridge Exploration
How Long Is Pacific Ridge Exploration's Cash Runway?
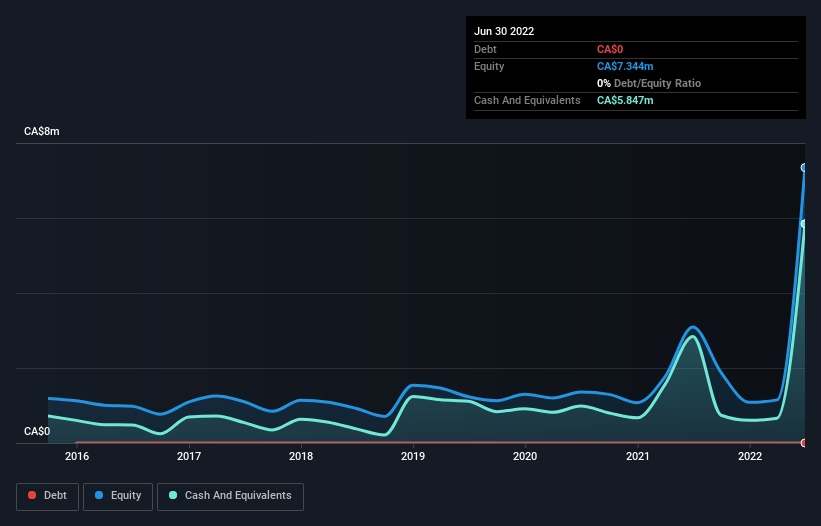
A company's cash runway is calculated by dividing its cash hoard by its cash burn. In June 2022, Pacific Ridge Exploration had CA$5.8m in cash, and was debt-free. In the last year, its cash burn was CA$6.3m. So it had a cash runway of approximately 11 months from June 2022. To be frank, this kind of short runway puts us on edge, as it indicates the company must reduce its cash burn significantly, or else raise cash imminently. The image below shows how its cash balance has been changing over the last few years.

How Is Pacific Ridge Exploration's Cash Burn Changing Over Time?
Pacific Ridge Exploration didn't record any revenue over the last year, indicating that it's an early stage company still developing its business. So while we can't look to sales to understand growth, we can look at how the cash burn is changing to understand how expenditure is trending over time. Its cash burn positively exploded in the last year, up 435%. Given that sharp increase in spending, the company's cash runway will shrink rapidly as it depletes its cash reserves. Pacific Ridge Exploration makes us a little nervous due to its lack of substantial operating revenue. So we'd generally prefer stocks from this list of stocks that have analysts forecasting growth.
How Easily Can Pacific Ridge Exploration Raise Cash?
Given its cash burn trajectory, Pacific Ridge Exploration shareholders should already be thinking about how easy it might be for it to raise further cash in the future. Issuing new shares, or taking on debt, are the most common ways for a listed company to raise more money for its business. One of the main advantages held by publicly listed companies is that they can sell shares to investors to raise cash and fund growth. By looking at a company's cash burn relative to its market capitalisation, we gain insight on how much shareholders would be diluted if the company needed to raise enough cash to cover another year's cash burn.
Since it has a market capitalisation of CA$26m, Pacific Ridge Exploration's CA$6.3m in cash burn equates to about 24% of its market value. That's not insignificant, and if the company had to sell enough shares to fund another year's growth at the current share price, you'd likely witness fairly costly dilution.
So, Should We Worry About Pacific Ridge Exploration's Cash Burn?
We must admit that we don't think Pacific Ridge Exploration is in a very strong position, when it comes to its cash burn. While its cash burn relative to its market cap wasn't too bad, its increasing cash burn does leave us rather nervous. After looking at that range of measures, we think shareholders should be extremely attentive to how the company is using its cash, as the cash burn makes us uncomfortable. Separately, we looked at different risks affecting the company and spotted 5 warning signs for Pacific Ridge Exploration (of which 4 shouldn't be ignored!) you should know about.
Of course, you might find a fantastic investment by looking elsewhere. So take a peek at this free list of companies insiders are buying, and this list of stocks growth stocks (according to analyst forecasts)
New: Manage All Your Stock Portfolios in One Place
We've created the ultimate portfolio companion for stock investors, and it's free.
• Connect an unlimited number of Portfolios and see your total in one currency
• Be alerted to new Warning Signs or Risks via email or mobile
• Track the Fair Value of your stocks
Have feedback on this article? Concerned about the content? Get in touch with us directly. Alternatively, email editorial-team (at) simplywallst.com.
This article by Simply Wall St is general in nature. We provide commentary based on historical data and analyst forecasts only using an unbiased methodology and our articles are not intended to be financial advice. It does not constitute a recommendation to buy or sell any stock, and does not take account of your objectives, or your financial situation. We aim to bring you long-term focused analysis driven by fundamental data. Note that our analysis may not factor in the latest price-sensitive company announcements or qualitative material. Simply Wall St has no position in any stocks mentioned.
About TSXV:PEX
Pacific Ridge Exploration
Engages in the acquisition and exploration of resource properties in Canada and the United States.
Medium-low risk with adequate balance sheet.
Market Insights
Community Narratives


Recently Updated Narratives


Alphabet: The Under-appreciated Compounder Hiding in Plain Sight


MINISO's fair value is projected at 26.69 with an anticipated PE ratio shift of 20x


The Quiet Giant That Became AI’s Power Grid
Popular Narratives


The company that turned a verb into a global necessity and basically runs the modern internet, digital ads, smartphones, maps, and AI.


MicroVision will explode future revenue by 380.37% with a vision towards success


