
Advertisement

Warren Buffett famously said, 'Volatility is far from synonymous with risk.' When we think about how risky a company is, we always like to look at its use of debt, since debt overload can lead to ruin. As with many other companies Magna Gold Corp. (CVE:MGR) makes use of debt. But the more important question is: how much risk is that debt creating?
What Risk Does Debt Bring?
Debt assists a business until the business has trouble paying it off, either with new capital or with free cash flow. If things get really bad, the lenders can take control of the business. However, a more usual (but still expensive) situation is where a company must dilute shareholders at a cheap share price simply to get debt under control. By replacing dilution, though, debt can be an extremely good tool for businesses that need capital to invest in growth at high rates of return. The first step when considering a company's debt levels is to consider its cash and debt together.
View our latest analysis for Magna Gold
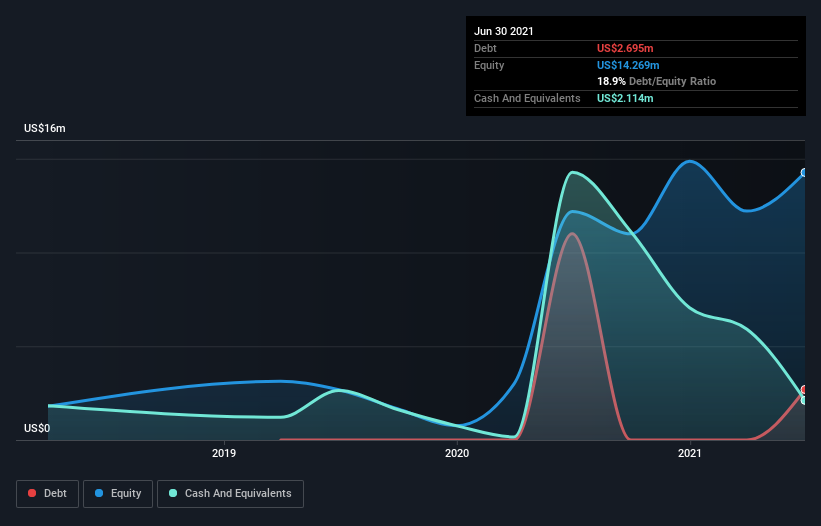
How Much Debt Does Magna Gold Carry?
You can click the graphic below for the historical numbers, but it shows that Magna Gold had US$2.70m of debt in June 2021, down from US$11.0m, one year before. On the flip side, it has US$2.11m in cash leading to net debt of about US$581.0k.
How Healthy Is Magna Gold's Balance Sheet?
According to the last reported balance sheet, Magna Gold had liabilities of US$46.1m due within 12 months, and liabilities of US$11.0m due beyond 12 months. On the other hand, it had cash of US$2.11m and US$8.82m worth of receivables due within a year. So it has liabilities totalling US$46.1m more than its cash and near-term receivables, combined.
This is a mountain of leverage relative to its market capitalization of US$60.4m. Should its lenders demand that it shore up the balance sheet, shareholders would likely face severe dilution. But either way, Magna Gold has virtually no net debt, so it's fair to say it does not have a heavy debt load! There's no doubt that we learn most about debt from the balance sheet. But it is Magna Gold's earnings that will influence how the balance sheet holds up in the future. So if you're keen to discover more about its earnings, it might be worth checking out this graph of its long term earnings trend.
Over 12 months, Magna Gold reported revenue of US$77m, which is a gain of 815%, although it did not report any earnings before interest and tax. When it comes to revenue growth, that's like nailing the game winning 3-pointer!
Caveat Emptor
Despite the top line growth, Magna Gold still had an earnings before interest and tax (EBIT) loss over the last year. Indeed, it lost a very considerable US$9.1m at the EBIT level. When we look at that and recall the liabilities on its balance sheet, relative to cash, it seems unwise to us for the company to have any debt. Quite frankly we think the balance sheet is far from match-fit, although it could be improved with time. Another cause for caution is that is bled US$13m in negative free cash flow over the last twelve months. So in short it's a really risky stock. The balance sheet is clearly the area to focus on when you are analysing debt. But ultimately, every company can contain risks that exist outside of the balance sheet. We've identified 4 warning signs with Magna Gold (at least 1 which shouldn't be ignored) , and understanding them should be part of your investment process.
At the end of the day, it's often better to focus on companies that are free from net debt. You can access our special list of such companies (all with a track record of profit growth). It's free.
New: Manage All Your Stock Portfolios in One Place
We've created the ultimate portfolio companion for stock investors, and it's free.
• Connect an unlimited number of Portfolios and see your total in one currency
• Be alerted to new Warning Signs or Risks via email or mobile
• Track the Fair Value of your stocks
This article by Simply Wall St is general in nature. We provide commentary based on historical data and analyst forecasts only using an unbiased methodology and our articles are not intended to be financial advice. It does not constitute a recommendation to buy or sell any stock, and does not take account of your objectives, or your financial situation. We aim to bring you long-term focused analysis driven by fundamental data. Note that our analysis may not factor in the latest price-sensitive company announcements or qualitative material. Simply Wall St has no position in any stocks mentioned.
Have feedback on this article? Concerned about the content? Get in touch with us directly. Alternatively, email editorial-team (at) simplywallst.com.
About TSXV:MGR.H
Magna Gold
Engages in the acquisition, exploration, development, and operation of mineral properties in Mexico.
Low with weak fundamentals.
Market Insights


Advertisement
Community Narratives
For the Emperor: Why Games Workshop Could Be a Star Investment
Fair Value UK£160.00|0.1% overvalued
RO
Community Contributor
Securitas will boost margins with AI and tech-driven services
Fair Value SEK 260.91|44.5% undervalued
UN
Community Contributor
A Leader in EV Charging with Growth Potential
Fair Value €27.00|20.9% undervalued
TI
Community Contributor