
Advertisement

The goal of this article is to teach you how to use price to earnings ratios (P/E ratios). We'll show how you can use Imaflex Inc.'s (CVE:IFX) P/E ratio to inform your assessment of the investment opportunity. What is Imaflex's P/E ratio? Well, based on the last twelve months it is 18.17. That means that at current prices, buyers pay CA$18.17 for every CA$1 in trailing yearly profits.
Check out our latest analysis for Imaflex
How Do I Calculate A Price To Earnings Ratio?
The formula for price to earnings is:
Price to Earnings Ratio = Price per Share ÷ Earnings per Share (EPS)
Or for Imaflex:
P/E of 18.17 = CAD0.65 ÷ CAD0.04 (Based on the trailing twelve months to September 2019.)
Is A High P/E Ratio Good?
The higher the P/E ratio, the higher the price tag of a business, relative to its trailing earnings. All else being equal, it's better to pay a low price -- but as Warren Buffett said, 'It's far better to buy a wonderful company at a fair price than a fair company at a wonderful price'.
How Does Imaflex's P/E Ratio Compare To Its Peers?
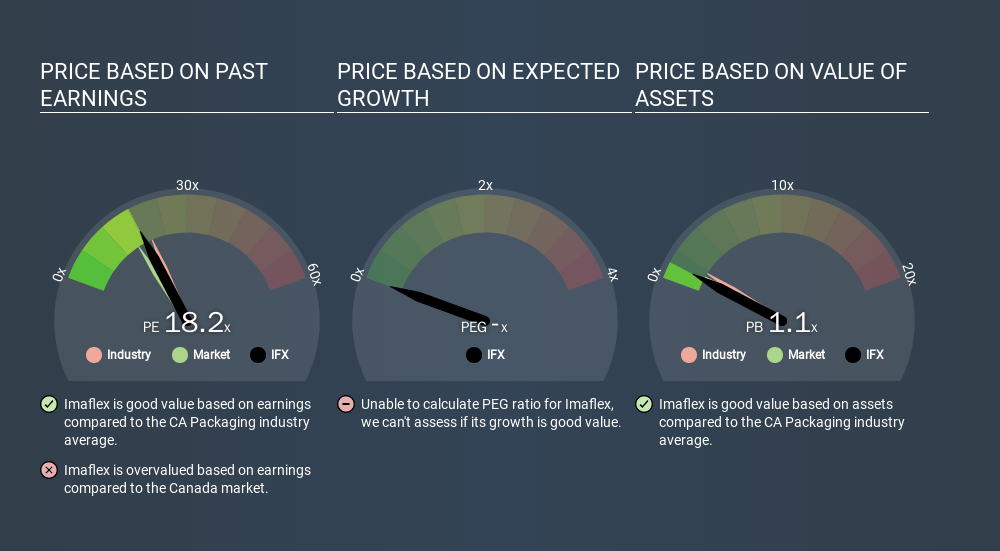
The P/E ratio indicates whether the market has higher or lower expectations of a company. The image below shows that Imaflex has a lower P/E than the average (20.0) P/E for companies in the packaging industry.
This suggests that market participants think Imaflex will underperform other companies in its industry. Many investors like to buy stocks when the market is pessimistic about their prospects. If you consider the stock interesting, further research is recommended. For example, I often monitor director buying and selling.
How Growth Rates Impact P/E Ratios
Earnings growth rates have a big influence on P/E ratios. That's because companies that grow earnings per share quickly will rapidly increase the 'E' in the equation. That means even if the current P/E is high, it will reduce over time if the share price stays flat. So while a stock may look expensive based on past earnings, it could be cheap based on future earnings.
Imaflex's earnings per share fell by 53% in the last twelve months. But EPS is up 47% over the last 3 years.
A Limitation: P/E Ratios Ignore Debt and Cash In The Bank
The 'Price' in P/E reflects the market capitalization of the company. That means it doesn't take debt or cash into account. In theory, a company can lower its future P/E ratio by using cash or debt to invest in growth.
Spending on growth might be good or bad a few years later, but the point is that the P/E ratio does not account for the option (or lack thereof).
Is Debt Impacting Imaflex's P/E?
Net debt is 42% of Imaflex's market cap. While that's enough to warrant consideration, it doesn't really concern us.
The Bottom Line On Imaflex's P/E Ratio
Imaflex trades on a P/E ratio of 18.2, which is above its market average of 15.9. With a bit of debt, but a lack of recent growth, it's safe to say the market is expecting improved profit performance from the company, in the next few years.
Investors have an opportunity when market expectations about a stock are wrong. People often underestimate remarkable growth -- so investors can make money when fast growth is not fully appreciated. So this free visual report on analyst forecasts could hold the key to an excellent investment decision.
You might be able to find a better buy than Imaflex. If you want a selection of possible winners, check out this free list of interesting companies that trade on a P/E below 20 (but have proven they can grow earnings).
If you spot an error that warrants correction, please contact the editor at editorial-team@simplywallst.com. This article by Simply Wall St is general in nature. It does not constitute a recommendation to buy or sell any stock, and does not take account of your objectives, or your financial situation. Simply Wall St has no position in the stocks mentioned.
We aim to bring you long-term focused research analysis driven by fundamental data. Note that our analysis may not factor in the latest price-sensitive company announcements or qualitative material. Thank you for reading.
About TSXV:IFX
Imaflex
Develops, manufactures, and sells flexible packaging materials for agriculture and packaging industries in Canada, the United States, and internationally.
Flawless balance sheet and good value.
Market Insights


Advertisement
Community Narratives
The Future of Drug Testing? Fingerprint Tech Shows Serious Promise
Fair Value US$2.98|40.3% undervalued
JO
Community Contributor
Suncorp’s Next Chapter: Insurance-Only and Ready to Grow
Fair Value AU$22.83|7.9% undervalued
RO
Community Contributor
Thyssenkrupp Nucera Will Achieve Double-Digit Profits by 2030 Boosted by Hydrogen Growth
Fair Value €14.40|31.6% undervalued
CH
Community Contributor
Tesla’s Nvidia Moment – The AI & Robotics Inflection Point
Fair Value US$359.72|12.3% undervalued
BL
Community Contributor