
Advertisement
- Canada
- /
- Metals and Mining
- /
- TSXV:IB
There's Been No Shortage Of Growth Recently For IBC Advanced Alloys' (CVE:IB) Returns On Capital

If you're looking for a multi-bagger, there's a few things to keep an eye out for. Typically, we'll want to notice a trend of growing return on capital employed (ROCE) and alongside that, an expanding base of capital employed. Put simply, these types of businesses are compounding machines, meaning they are continually reinvesting their earnings at ever-higher rates of return. So on that note, IBC Advanced Alloys (CVE:IB) looks quite promising in regards to its trends of return on capital.
What is Return On Capital Employed (ROCE)?
For those who don't know, ROCE is a measure of a company's yearly pre-tax profit (its return), relative to the capital employed in the business. The formula for this calculation on IBC Advanced Alloys is:
Return on Capital Employed = Earnings Before Interest and Tax (EBIT) ÷ (Total Assets - Current Liabilities)
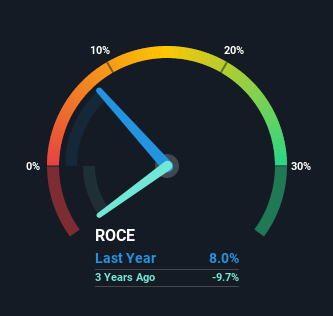
0.08 = US$1.1m ÷ (US$23m - US$10m) (Based on the trailing twelve months to December 2021).
Therefore, IBC Advanced Alloys has an ROCE of 8.0%. In absolute terms, that's a low return, but it's much better than the Metals and Mining industry average of 2.4%.
Check out our latest analysis for IBC Advanced Alloys
While the past is not representative of the future, it can be helpful to know how a company has performed historically, which is why we have this chart above. If you're interested in investigating IBC Advanced Alloys' past further, check out this free graph of past earnings, revenue and cash flow.
So How Is IBC Advanced Alloys' ROCE Trending?
The fact that IBC Advanced Alloys is now generating some pre-tax profits from its prior investments is very encouraging. Shareholders would no doubt be pleased with this because the business was loss-making five years ago but is is now generating 8.0% on its capital. And unsurprisingly, like most companies trying to break into the black, IBC Advanced Alloys is utilizing 54% more capital than it was five years ago. We like this trend, because it tells us the company has profitable reinvestment opportunities available to it, and if it continues going forward that can lead to a multi-bagger performance.
On a separate but related note, it's important to know that IBC Advanced Alloys has a current liabilities to total assets ratio of 43%, which we'd consider pretty high. This can bring about some risks because the company is basically operating with a rather large reliance on its suppliers or other sorts of short-term creditors. While it's not necessarily a bad thing, it can be beneficial if this ratio is lower.
In Conclusion...
To the delight of most shareholders, IBC Advanced Alloys has now broken into profitability. And since the stock has fallen 46% over the last five years, there might be an opportunity here. So researching this company further and determining whether or not these trends will continue seems justified.
One more thing to note, we've identified 3 warning signs with IBC Advanced Alloys and understanding them should be part of your investment process.
While IBC Advanced Alloys isn't earning the highest return, check out this free list of companies that are earning high returns on equity with solid balance sheets.
New: AI Stock Screener & Alerts
Our new AI Stock Screener scans the market every day to uncover opportunities.
• Dividend Powerhouses (3%+ Yield)
• Undervalued Small Caps with Insider Buying
• High growth Tech and AI Companies
Or build your own from over 50 metrics.
Have feedback on this article? Concerned about the content? Get in touch with us directly. Alternatively, email editorial-team (at) simplywallst.com.
This article by Simply Wall St is general in nature. We provide commentary based on historical data and analyst forecasts only using an unbiased methodology and our articles are not intended to be financial advice. It does not constitute a recommendation to buy or sell any stock, and does not take account of your objectives, or your financial situation. We aim to bring you long-term focused analysis driven by fundamental data. Note that our analysis may not factor in the latest price-sensitive company announcements or qualitative material. Simply Wall St has no position in any stocks mentioned.
About TSXV:IB
IBC Advanced Alloys
Develops, produces, and sells specialty alloy products in China, the Netherlands, Japan, Canada, Germany, Taiwan, and internationally.
Good value with mediocre balance sheet.
Similar Companies
Market Insights


Advertisement
Community Narratives
MicroStrategy: Volatile Gamble or Golden Opportunity?
Fair Value US$663.00|31.2% undervalued
BL
Community Contributor
Emerging Markets and Debt Reduction Will Propel Bath & Body Works Forward
Fair Value US$40.73|24.4% undervalued
ZW
Community Contributor
An amazing opportunity to potentially get a 100 bagger
Fair Value US$10.00|13.5% overvalued
DA
Community Contributor