
Advertisement
- Canada
- /
- Metals and Mining
- /
- TSXV:IB
Lacklustre Performance Is Driving IBC Advanced Alloys Corp.'s (CVE:IB) 31% Price Drop
IBC Advanced Alloys Corp. (CVE:IB) shares have had a horrible month, losing 31% after a relatively good period beforehand. The recent drop completes a disastrous twelve months for shareholders, who are sitting on a 65% loss during that time.
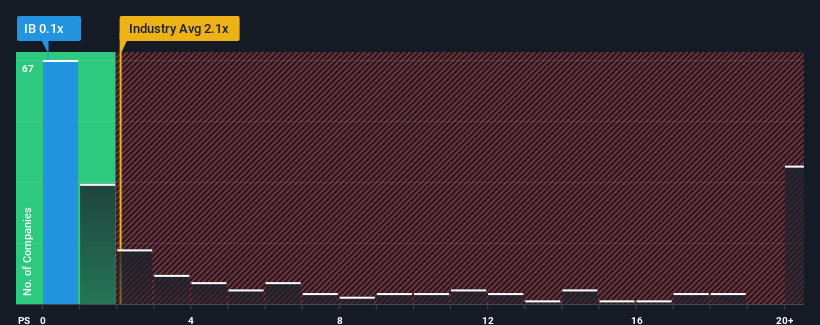
Since its price has dipped substantially, IBC Advanced Alloys' price-to-sales (or "P/S") ratio of 0.1x might make it look like a buy right now compared to the Metals and Mining industry in Canada, where around half of the companies have P/S ratios above 2.1x and even P/S above 14x are quite common. However, the P/S might be low for a reason and it requires further investigation to determine if it's justified.
Check out our latest analysis for IBC Advanced Alloys
How Has IBC Advanced Alloys Performed Recently?
Revenue has risen firmly for IBC Advanced Alloys recently, which is pleasing to see. Perhaps the market is expecting this acceptable revenue performance to take a dive, which has kept the P/S suppressed. If that doesn't eventuate, then existing shareholders have reason to be optimistic about the future direction of the share price.
Although there are no analyst estimates available for IBC Advanced Alloys, take a look at this free data-rich visualisation to see how the company stacks up on earnings, revenue and cash flow.How Is IBC Advanced Alloys' Revenue Growth Trending?
There's an inherent assumption that a company should underperform the industry for P/S ratios like IBC Advanced Alloys' to be considered reasonable.
If we review the last year of revenue growth, the company posted a worthy increase of 14%. The latest three year period has also seen an excellent 42% overall rise in revenue, aided somewhat by its short-term performance. So we can start by confirming that the company has done a great job of growing revenues over that time.
Comparing that to the industry, which is predicted to deliver 15% growth in the next 12 months, the company's momentum is weaker, based on recent medium-term annualised revenue results.
In light of this, it's understandable that IBC Advanced Alloys' P/S sits below the majority of other companies. It seems most investors are expecting to see the recent limited growth rates continue into the future and are only willing to pay a reduced amount for the stock.
The Final Word
IBC Advanced Alloys' P/S has taken a dip along with its share price. It's argued the price-to-sales ratio is an inferior measure of value within certain industries, but it can be a powerful business sentiment indicator.
As we suspected, our examination of IBC Advanced Alloys revealed its three-year revenue trends are contributing to its low P/S, given they look worse than current industry expectations. At this stage investors feel the potential for an improvement in revenue isn't great enough to justify a higher P/S ratio. Unless the recent medium-term conditions improve, they will continue to form a barrier for the share price around these levels.
You need to take note of risks, for example - IBC Advanced Alloys has 5 warning signs (and 4 which can't be ignored) we think you should know about.
If companies with solid past earnings growth is up your alley, you may wish to see this free collection of other companies with strong earnings growth and low P/E ratios.
New: AI Stock Screener & Alerts
Our new AI Stock Screener scans the market every day to uncover opportunities.
• Dividend Powerhouses (3%+ Yield)
• Undervalued Small Caps with Insider Buying
• High growth Tech and AI Companies
Or build your own from over 50 metrics.
Have feedback on this article? Concerned about the content? Get in touch with us directly. Alternatively, email editorial-team (at) simplywallst.com.
This article by Simply Wall St is general in nature. We provide commentary based on historical data and analyst forecasts only using an unbiased methodology and our articles are not intended to be financial advice. It does not constitute a recommendation to buy or sell any stock, and does not take account of your objectives, or your financial situation. We aim to bring you long-term focused analysis driven by fundamental data. Note that our analysis may not factor in the latest price-sensitive company announcements or qualitative material. Simply Wall St has no position in any stocks mentioned.
About TSXV:IB
IBC Advanced Alloys
Develops, produces, and sells specialty alloy products in the United States, China, the Netherlands, Japan, Canada, Germany, South Korea, Taiwan, Italy, and internationally.
Mediocre balance sheet and slightly overvalued.
Similar Companies
Market Insights

Advertisement
Community Narratives
MINISO's fair value is projected at 26.69 with an anticipated PE ratio shift of 20x
Fair Value US$24.03|11.0% undervalued
BE
Community Contributor
Procter & Gamble: A Dividend Giant Facing Slowing Growth
Fair Value US$119.81|23.3% overvalued
AN
Community Contributor
Eli Lilly's Future Growth Driven by Tirzepatide and Favorable Market Conditions
Fair Value US$1.19k|13.8% undervalued
EA
Community Contributor