
Advertisement
- Canada
- /
- Metals and Mining
- /
- TSXV:AFM
Is Alphamin Resources Corp.'s (CVE:AFM) Latest Stock Performance A Reflection Of Its Financial Health?

Most readers would already be aware that Alphamin Resources' (CVE:AFM) stock increased significantly by 35% over the past month. Given that the market rewards strong financials in the long-term, we wonder if that is the case in this instance. In this article, we decided to focus on Alphamin Resources' ROE.
Return on Equity or ROE is a test of how effectively a company is growing its value and managing investors’ money. Simply put, it is used to assess the profitability of a company in relation to its equity capital.
View our latest analysis for Alphamin Resources
How Do You Calculate Return On Equity?
The formula for ROE is:
Return on Equity = Net Profit (from continuing operations) ÷ Shareholders' Equity
So, based on the above formula, the ROE for Alphamin Resources is:
18% = US$68m ÷ US$380m (Based on the trailing twelve months to June 2024).
The 'return' is the amount earned after tax over the last twelve months. Another way to think of that is that for every CA$1 worth of equity, the company was able to earn CA$0.18 in profit.
What Has ROE Got To Do With Earnings Growth?
So far, we've learned that ROE is a measure of a company's profitability. We now need to evaluate how much profit the company reinvests or "retains" for future growth which then gives us an idea about the growth potential of the company. Generally speaking, other things being equal, firms with a high return on equity and profit retention, have a higher growth rate than firms that don’t share these attributes.
Alphamin Resources' Earnings Growth And 18% ROE
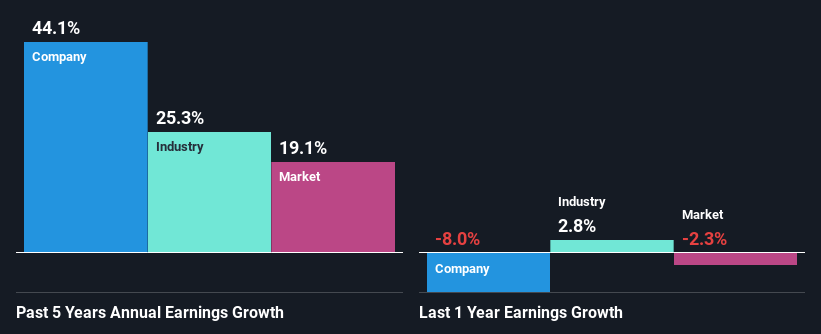
To begin with, Alphamin Resources seems to have a respectable ROE. Further, the company's ROE compares quite favorably to the industry average of 9.2%. This probably laid the ground for Alphamin Resources' significant 44% net income growth seen over the past five years. We believe that there might also be other aspects that are positively influencing the company's earnings growth. For instance, the company has a low payout ratio or is being managed efficiently.
We then compared Alphamin Resources' net income growth with the industry and we're pleased to see that the company's growth figure is higher when compared with the industry which has a growth rate of 25% in the same 5-year period.
The basis for attaching value to a company is, to a great extent, tied to its earnings growth. What investors need to determine next is if the expected earnings growth, or the lack of it, is already built into the share price. Doing so will help them establish if the stock's future looks promising or ominous. One good indicator of expected earnings growth is the P/E ratio which determines the price the market is willing to pay for a stock based on its earnings prospects. So, you may want to check if Alphamin Resources is trading on a high P/E or a low P/E, relative to its industry.
Is Alphamin Resources Using Its Retained Earnings Effectively?
Alphamin Resources' significant three-year median payout ratio of 59% (where it is retaining only 41% of its income) suggests that the company has been able to achieve a high growth in earnings despite returning most of its income to shareholders.
Moreover, Alphamin Resources is determined to keep sharing its profits with shareholders which we infer from its long history of three years of paying a dividend.
Conclusion
Overall, we are quite pleased with Alphamin Resources' performance. In particular, its high ROE is quite noteworthy and also the probable explanation behind its considerable earnings growth. Yet, the company is retaining a small portion of its profits. Which means that the company has been able to grow its earnings in spite of it, so that's not too bad. So far, we've only made a quick discussion around the company's earnings growth. So it may be worth checking this free detailed graph of Alphamin Resources' past earnings, as well as revenue and cash flows to get a deeper insight into the company's performance.
New: Manage All Your Stock Portfolios in One Place
We've created the ultimate portfolio companion for stock investors, and it's free.
• Connect an unlimited number of Portfolios and see your total in one currency
• Be alerted to new Warning Signs or Risks via email or mobile
• Track the Fair Value of your stocks
Have feedback on this article? Concerned about the content? Get in touch with us directly. Alternatively, email editorial-team (at) simplywallst.com.
This article by Simply Wall St is general in nature. We provide commentary based on historical data and analyst forecasts only using an unbiased methodology and our articles are not intended to be financial advice. It does not constitute a recommendation to buy or sell any stock, and does not take account of your objectives, or your financial situation. We aim to bring you long-term focused analysis driven by fundamental data. Note that our analysis may not factor in the latest price-sensitive company announcements or qualitative material. Simply Wall St has no position in any stocks mentioned.
About TSXV:AFM
Alphamin Resources
Engages in the production and sale of tin concentrate.
Outstanding track record with flawless balance sheet and pays a dividend.
Market Insights


Advertisement
Community Narratives
For the Emperor: Why Games Workshop Could Be a Star Investment
Fair Value UK£160.00|0.4% undervalued
RO
Community Contributor
Securitas will boost margins with AI and tech-driven services
Fair Value SEK 260.91|45.0% undervalued
UN
Community Contributor
A Leader in EV Charging with Growth Potential
Fair Value €27.00|20.4% undervalued
TI
Community Contributor