
Advertisement
There's no doubt that money can be made by owning shares of unprofitable businesses. For example, biotech and mining exploration companies often lose money for years before finding success with a new treatment or mineral discovery. But while the successes are well known, investors should not ignore the very many unprofitable companies that simply burn through all their cash and collapse.
So, the natural question for Talon Metals (TSE:TLO) shareholders is whether they should be concerned by its rate of cash burn. For the purpose of this article, we'll define cash burn as the amount of cash the company is spending each year to fund its growth (also called its negative free cash flow). We'll start by comparing its cash burn with its cash reserves in order to calculate its cash runway.
Check out our latest analysis for Talon Metals
How Long Is Talon Metals' Cash Runway?
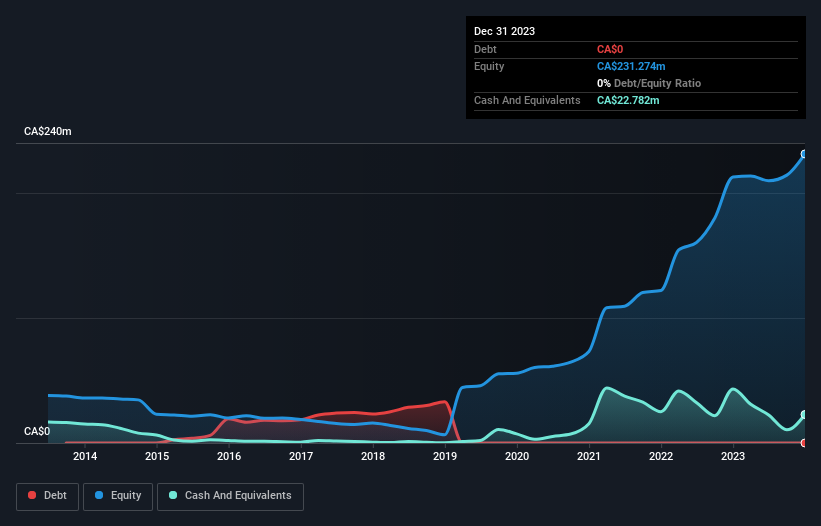
A company's cash runway is calculated by dividing its cash hoard by its cash burn. In December 2023, Talon Metals had CA$23m in cash, and was debt-free. In the last year, its cash burn was CA$42m. So it had a cash runway of approximately 7 months from December 2023. That's quite a short cash runway, indicating the company must either reduce its annual cash burn or replenish its cash. Importantly, if we extrapolate recent cash burn trends, the cash runway would be noticeably longer. Depicted below, you can see how its cash holdings have changed over time.
How Is Talon Metals' Cash Burn Changing Over Time?
Talon Metals didn't record any revenue over the last year, indicating that it's an early stage company still developing its business. So while we can't look to sales to understand growth, we can look at how the cash burn is changing to understand how expenditure is trending over time. As it happens, the company's cash burn reduced by 17% over the last year, which suggests that management may be mindful of the risks of their depleting cash reserves. Clearly, however, the crucial factor is whether the company will grow its business going forward. For that reason, it makes a lot of sense to take a look at our analyst forecasts for the company.
Can Talon Metals Raise More Cash Easily?
While Talon Metals is showing a solid reduction in its cash burn, it's still worth considering how easily it could raise more cash, even just to fuel faster growth. Issuing new shares, or taking on debt, are the most common ways for a listed company to raise more money for its business. One of the main advantages held by publicly listed companies is that they can sell shares to investors to raise cash and fund growth. By comparing a company's annual cash burn to its total market capitalisation, we can estimate roughly how many shares it would have to issue in order to run the company for another year (at the same burn rate).
Talon Metals' cash burn of CA$42m is about 37% of its CA$112m market capitalisation. That's fairly notable cash burn, so if the company had to sell shares to cover the cost of another year's operations, shareholders would suffer some costly dilution.
How Risky Is Talon Metals' Cash Burn Situation?
Even though its cash runway makes us a little nervous, we are compelled to mention that we thought Talon Metals' cash burn reduction was relatively promising. After looking at that range of measures, we think shareholders should be extremely attentive to how the company is using its cash, as the cash burn makes us uncomfortable. On another note, Talon Metals has 6 warning signs (and 2 which are significant) we think you should know about.
Of course, you might find a fantastic investment by looking elsewhere. So take a peek at this free list of companies insiders are buying, and this list of stocks growth stocks (according to analyst forecasts)
Valuation is complex, but we're here to simplify it.
Discover if Talon Metals might be undervalued or overvalued with our detailed analysis, featuring fair value estimates, potential risks, dividends, insider trades, and its financial condition.
Access Free AnalysisHave feedback on this article? Concerned about the content? Get in touch with us directly. Alternatively, email editorial-team (at) simplywallst.com.
This article by Simply Wall St is general in nature. We provide commentary based on historical data and analyst forecasts only using an unbiased methodology and our articles are not intended to be financial advice. It does not constitute a recommendation to buy or sell any stock, and does not take account of your objectives, or your financial situation. We aim to bring you long-term focused analysis driven by fundamental data. Note that our analysis may not factor in the latest price-sensitive company announcements or qualitative material. Simply Wall St has no position in any stocks mentioned.
About TSX:TLO
Talon Metals
A mineral exploration company, explores for and develops mineral properties in the United States.
Excellent balance sheet with slight risk.
Market Insights

Advertisement
Community Narratives
MicroVision will explode future revenue by 380.37% with a vision towards success
Fair Value US$60|98.4% undervalued
TH
Community Contributor
The Indispensable Artery for a New North American Economy
Fair Value CA$132.87|0.7% overvalued
TI
Community Contributor
Recently Updated Narratives
CE

cementafriend on Constellation Energy ·
Constellation Energy Dividends and Growth
Fair Value:US$348.054.7% overvalued
2 followersusers have followed this narrative
0 commentsusers have commented on this narrative
0 likesusers have liked this narrative
KH

Khagani on CoreWeave ·
CoreWeave's Revenue Expected to Rocket 77.88% in 5-Year Forecast
Fair Value:US$11033.5% undervalued
3 followersusers have followed this narrative
0 commentsusers have commented on this narrative
0 likesusers have liked this narrative
PO

PortfolioPlus on Bisalloy Steel Group ·
Bisalloy Steel Group will shine with a projected profit margin increase of 12.8%
Fair Value:AU$6.7118.0% undervalued
3 followersusers have followed this narrative
0 commentsusers have commented on this narrative
0 likesusers have liked this narrative
Popular Narratives
TH

TheWallstreetKing on MicroVision ·
MicroVision will explode future revenue by 380.37% with a vision towards success
Fair Value:US$6098.4% undervalued
106 followersusers have followed this narrative
10 commentsusers have commented on this narrative
21 likesusers have liked this narrative
AN


AnalystConsensusTarget on NVIDIA ·
NVDA: Expanding AI Demand Will Drive Major Data Center Investments Through 2026
Fair Value:US$250.3929.3% undervalued
936 followersusers have followed this narrative
6 commentsusers have commented on this narrative
24 likesusers have liked this narrative
OS


oscargarcia on Alphabet ·
The company that turned a verb into a global necessity and basically runs the modern internet, digital ads, smartphones, maps, and AI.
Fair Value:US$3405.8% undervalued
143 followersusers have followed this narrative
6 commentsusers have commented on this narrative
18 likesusers have liked this narrative