Advertisement
- Canada
- /
- Metals and Mining
- /
- TSX:TECK.B
Assessing Teck Resources After Recent 30% Price Surge and Green Energy Expansion Plans

Simply Wall St
Reviewed by Bailey Pemberton
Trying to figure out what to do with Teck Resources right now? You are not alone. The stock has been on a bit of a rollercoaster lately, and it is a name that tends to stir up opinions. Teck’s share price popped nearly 30% in the past month alone, even after a rocky stretch that left it down 13.5% over the last year. Short-term traders just saw a 4.4% gain in the past week, and the longer-term story is even wilder, with a 253.8% gain over five years. That kind of performance definitely grabs attention, and it is raising a lot of conversations about the company’s future growth prospects and risk profile.
Some of those big moves are tied to the overall strength in commodities markets, with global economic themes and shifting investor sentiment shaking things up. Supply chain adjustments and strategic decisions within the sector have given mining stocks newfound energy at times, and Teck has been right in the mix. But as much as the narrative has been about momentum, many want to know: is Teck undervalued, or are we already seeing its fair value reflected in the price?
When we run the numbers, the company currently scores a 0 out of 6 on standard undervaluation checks, meaning no green lights across the usual valuation yardsticks. That might surprise some, considering the big swings in price, so how do we make sense of this? In the next section, we will break down those valuation approaches and reveal a more meaningful way to assess Teck’s real worth at the end of the article.
Teck Resources scores just 0/6 on our valuation checks. See what other red flags we found in the full valuation breakdown.
Approach 1: Teck Resources Discounted Cash Flow (DCF) Analysis
A Discounted Cash Flow (DCF) model estimates a company’s intrinsic value by projecting its future free cash flows and discounting those flows back to today’s value. Simply put, it looks at the money Teck Resources is expected to generate over time and calculates what that future income is worth now.
According to the latest figures, Teck Resources posted a last twelve months Free Cash Flow (FCF) of negative CA$2.97 billion. However, analysts forecast a significant turnaround, projecting FCF to become positive and reach as high as CA$1.94 billion by 2029. Beyond that point, estimates are extrapolated because detailed analyst forecasts only extend about five years. These projections use a 2 Stage Free Cash Flow to Equity model to extend the FCF outlook further into the next decade.
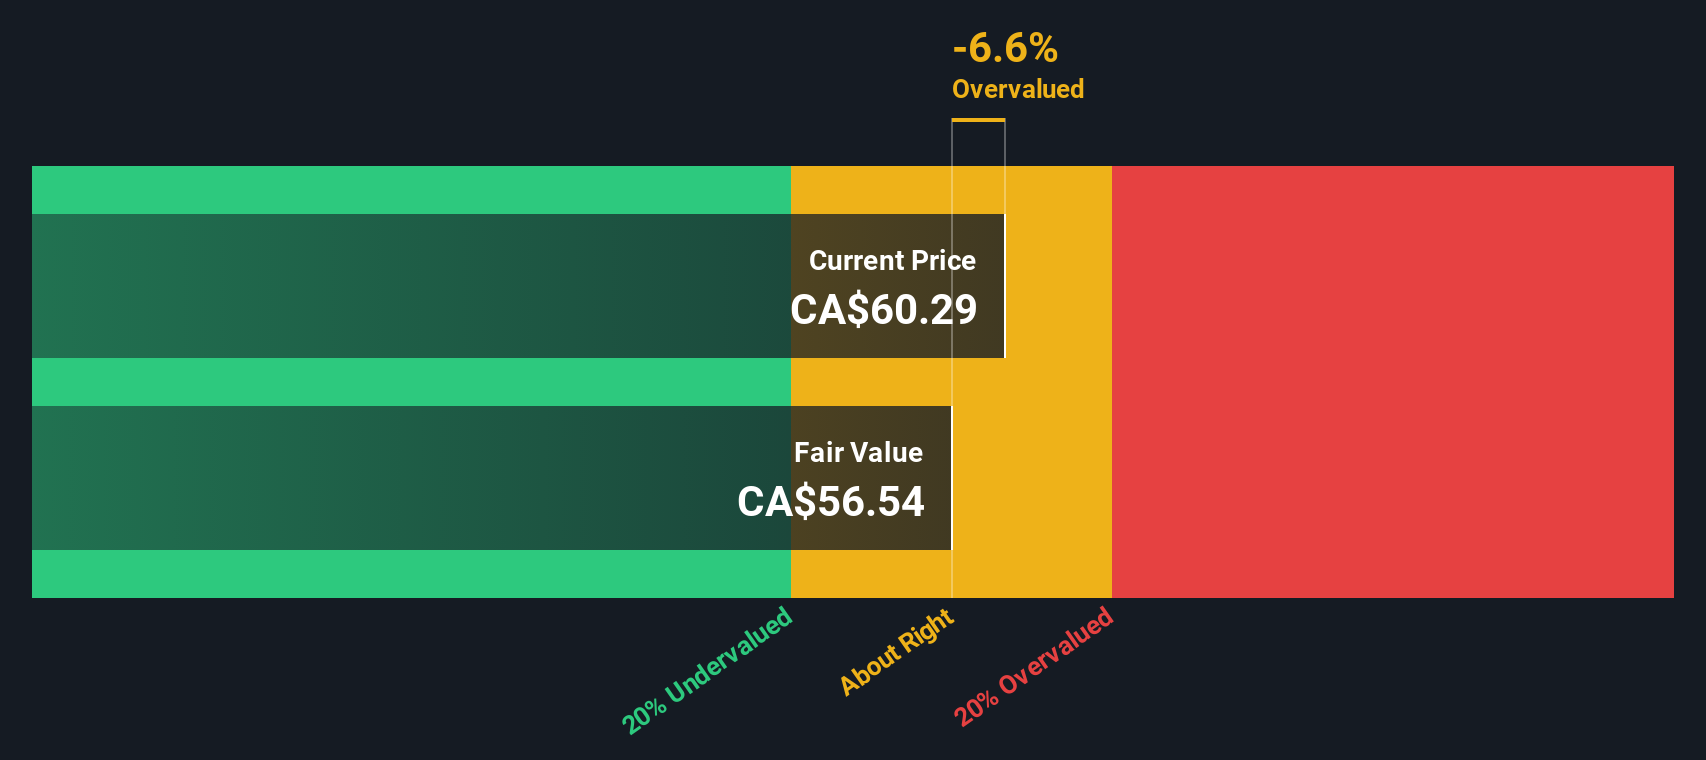
Based on this DCF approach, Teck’s estimated intrinsic value comes to CA$56.53 per share. This value is just 6.6% above the current share price, suggesting Teck stock is trading pretty close to its “true” worth. In other words, today’s market price already reflects the majority of projected future growth and risks.
Result: ABOUT RIGHT
Simply Wall St performs a valuation analysis on every stock in the world every day (check out Teck Resources's valuation analysis). We show the entire calculation in full. You can track the result in your watchlist or portfolio and be alerted when this changes.
Approach 2: Teck Resources Price vs Earnings (PE)
The Price-to-Earnings (PE) ratio is one of the most widely used valuation metrics for established, profitable companies. It tells investors how much they are paying for each dollar of a company’s earnings, giving a quick sense of whether a stock is expensive or cheap relative to its profit generation right now.
Growth expectations and risk play a major role in what qualifies as a “normal” or “fair” PE multiple. Companies with strong earnings growth ahead, for example, will often trade at higher PE ratios, as investors anticipate bigger profits down the road. Conversely, stocks with more uncertainty or slower growth typically deserve lower PE multiples.
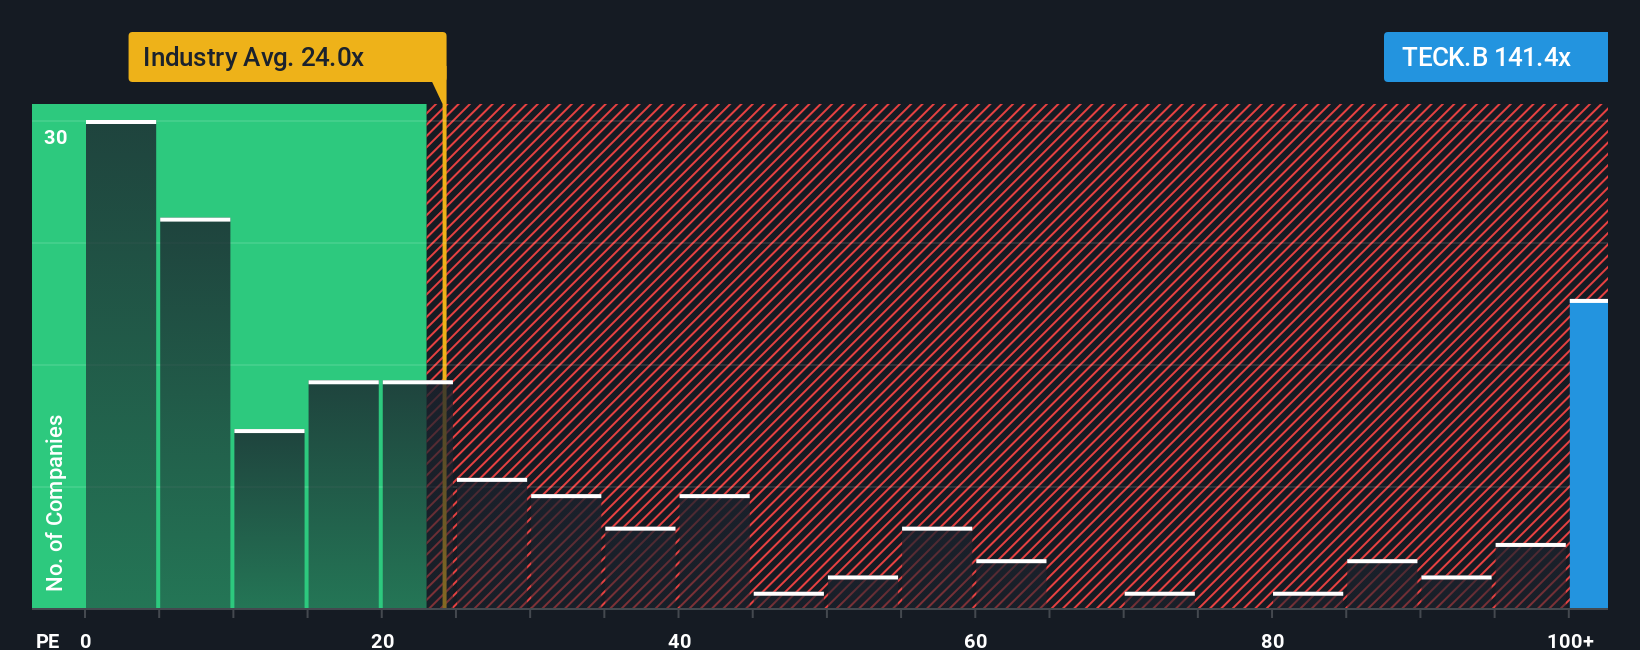
Teck Resources currently trades at a PE ratio of 141.44x. This is dramatically higher than the average for the Metals and Mining industry, which sits at 23.09x, and also exceeds the average for its closest peers at 45.11x. However, it is most useful to go beyond these broad comparisons and consider Simply Wall St’s “Fair Ratio,” a data-driven benchmark that accounts for the company’s unique growth outlook, profit margins, risks, market cap, and its industry context. In Teck’s case, the Fair Ratio is 26.27x. This tells us, based on the fundamentals, what multiple investors might reasonably pay for Teck right now.
Because the Fair Ratio incorporates growth, risk, profitability, and market cap, it provides a more accurate reflection of value compared to simply comparing Teck to the industry or its peers. This is especially important for companies where the near-term outlook or risk profile differs materially from the sector norm.
With Teck’s current PE multiple so far above its Fair Ratio, the stock appears significantly overvalued on this measure.
Result: OVERVALUED
PE ratios tell one story, but what if the real opportunity lies elsewhere? Discover companies where insiders are betting big on explosive growth.
Upgrade Your Decision Making: Choose your Teck Resources Narrative
Earlier we mentioned that there is an even better way to understand valuation, so let’s introduce you to Narratives. Put simply, a Narrative is your personal investment story, your point of view about Teck Resources, supported by your own forecasts for future earnings, margins, and what you believe the company is really worth. Narratives connect what you know about the business, its recent news, and where you think it is heading, directly to a financial forecast and a fair value. This approach makes investment decisions much more meaningful than relying on numbers alone.
Best of all, Narratives are interactive and easy to use on Simply Wall St’s Community page, where millions of investors compare their stories and outlook in real time. Narratives update automatically as fresh news or earnings data arrives, helping you quickly reassess your view and decide whether to buy, sell, or hold simply by comparing your Fair Value to the latest market price.
For example, some Teck investors have a bullish Narrative, forecasting revenue to reach CA$11.5 billion and a price target as high as CA$68.0, driven by strong copper expansion and industry demand. In contrast, bearish Narratives forecast a price target as low as CA$47.0, reflecting project risks and commodity price concerns. Your Narrative, based on your view and updated data, puts you in control.
Do you think there's more to the story for Teck Resources? Create your own Narrative to let the Community know!
This article by Simply Wall St is general in nature. We provide commentary based on historical data and analyst forecasts only using an unbiased methodology and our articles are not intended to be financial advice. It does not constitute a recommendation to buy or sell any stock, and does not take account of your objectives, or your financial situation. We aim to bring you long-term focused analysis driven by fundamental data. Note that our analysis may not factor in the latest price-sensitive company announcements or qualitative material. Simply Wall St has no position in any stocks mentioned.
Valuation is complex, but we're here to simplify it.
Discover if Teck Resources might be undervalued or overvalued with our detailed analysis, featuring fair value estimates, potential risks, dividends, insider trades, and its financial condition.
Access Free AnalysisHave feedback on this article? Concerned about the content? Get in touch with us directly. Alternatively, email editorial-team@simplywallst.com
About TSX:TECK.B
Teck Resources
Engages in research, exploration, development, processing, smelting, refining, and reclamation of mineral properties in Asia, the Americas, and Europe.
Mediocre balance sheet with limited growth.
Similar Companies
Market Insights

Advertisement
Community Narratives
The Next Phase of Energy Storage: How NeoVolta Is Tackling America’s Power Crunch
Fair Value US$7.50|35.1% undervalued
MA
Community Contributor
Why EnSilica is Worth Possibly 13x its Current Price
Fair Value UK£5.00|89.8% undervalued
DO
Community Contributor
M&A Activity, Industry Diversification & A Defense Contract Monopoly Will Push BWXT For Healthy Long-Term Growth
Fair Value US$220.00|15.2% undervalued
CL
Community Contributor
A case for Cassiar Gold Corp (TSXV: GLDC) to reach CAD$8-10 before 2030 (X30-37)
Fair Value CA$10.00|96.0% undervalued
AG
Community Contributor