- Canada
- /
- Metals and Mining
- /
- TSX:PAAS
The 12% return this week takes Pan American Silver's (TSE:PAAS) shareholders three-year gains to 45%

Buying a low-cost index fund will get you the average market return. But in any diversified portfolio of stocks, you'll see some that fall short of the average. Unfortunately for shareholders, while the Pan American Silver Corp. (TSE:PAAS) share price is up 38% in the last three years, that falls short of the market return. Unfortunately, the share price has fallen 31% over twelve months.
The past week has proven to be lucrative for Pan American Silver investors, so let's see if fundamentals drove the company's three-year performance.
View our latest analysis for Pan American Silver
There is no denying that markets are sometimes efficient, but prices do not always reflect underlying business performance. One way to examine how market sentiment has changed over time is to look at the interaction between a company's share price and its earnings per share (EPS).
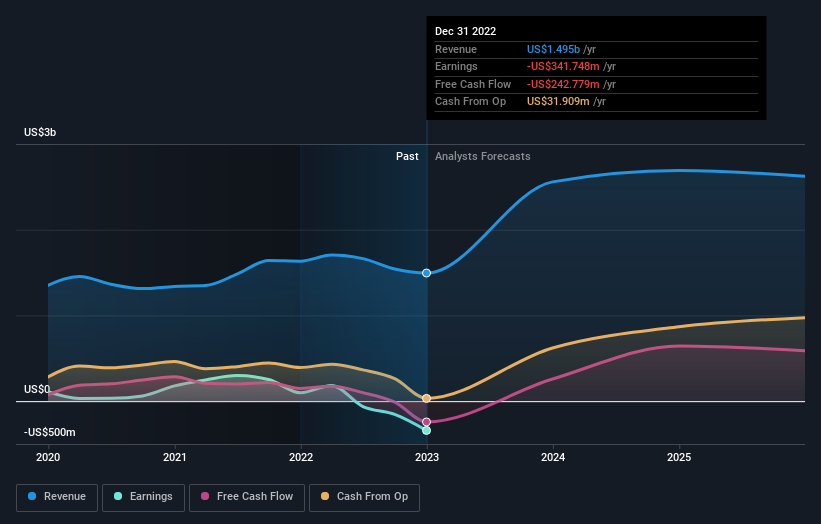
Over the last three years, Pan American Silver failed to grow earnings per share, which fell 54% (annualized).
This means it's unlikely the market is judging the company based on earnings growth. Given this situation, it makes sense to look at other metrics too.
It may well be that Pan American Silver revenue growth rate of 6.7% over three years has convinced shareholders to believe in a brighter future. In that case, the company may be sacrificing current earnings per share to drive growth, and maybe shareholder's faith in better days ahead will be rewarded.
The graphic below depicts how earnings and revenue have changed over time (unveil the exact values by clicking on the image).
This free interactive report on Pan American Silver's balance sheet strength is a great place to start, if you want to investigate the stock further.
What About Dividends?
As well as measuring the share price return, investors should also consider the total shareholder return (TSR). The TSR is a return calculation that accounts for the value of cash dividends (assuming that any dividend received was reinvested) and the calculated value of any discounted capital raisings and spin-offs. It's fair to say that the TSR gives a more complete picture for stocks that pay a dividend. As it happens, Pan American Silver's TSR for the last 3 years was 45%, which exceeds the share price return mentioned earlier. And there's no prize for guessing that the dividend payments largely explain the divergence!
A Different Perspective
While the broader market lost about 9.0% in the twelve months, Pan American Silver shareholders did even worse, losing 29% (even including dividends). However, it could simply be that the share price has been impacted by broader market jitters. It might be worth keeping an eye on the fundamentals, in case there's a good opportunity. On the bright side, long term shareholders have made money, with a gain of 4% per year over half a decade. If the fundamental data continues to indicate long term sustainable growth, the current sell-off could be an opportunity worth considering. I find it very interesting to look at share price over the long term as a proxy for business performance. But to truly gain insight, we need to consider other information, too. To that end, you should be aware of the 2 warning signs we've spotted with Pan American Silver .
If you would prefer to check out another company -- one with potentially superior financials -- then do not miss this free list of companies that have proven they can grow earnings.
Please note, the market returns quoted in this article reflect the market weighted average returns of stocks that currently trade on Canadian exchanges.
If you're looking to trade Pan American Silver, open an account with the lowest-cost platform trusted by professionals, Interactive Brokers.
With clients in over 200 countries and territories, and access to 160 markets, IBKR lets you trade stocks, options, futures, forex, bonds and funds from a single integrated account.
Enjoy no hidden fees, no account minimums, and FX conversion rates as low as 0.03%, far better than what most brokers offer.
Sponsored ContentNew: Manage All Your Stock Portfolios in One Place
We've created the ultimate portfolio companion for stock investors, and it's free.
• Connect an unlimited number of Portfolios and see your total in one currency
• Be alerted to new Warning Signs or Risks via email or mobile
• Track the Fair Value of your stocks
Have feedback on this article? Concerned about the content? Get in touch with us directly. Alternatively, email editorial-team (at) simplywallst.com.
This article by Simply Wall St is general in nature. We provide commentary based on historical data and analyst forecasts only using an unbiased methodology and our articles are not intended to be financial advice. It does not constitute a recommendation to buy or sell any stock, and does not take account of your objectives, or your financial situation. We aim to bring you long-term focused analysis driven by fundamental data. Note that our analysis may not factor in the latest price-sensitive company announcements or qualitative material. Simply Wall St has no position in any stocks mentioned.
About TSX:PAAS
Pan American Silver
Engages in the exploration, mine development, extraction, processing, refining, and reclamation of mines in Canada, Mexico, Peru, Bolivia, Argentina, Chile, and Brazil.
Adequate balance sheet with questionable track record.
Similar Companies
Market Insights

Community Narratives

