
The external fund manager backed by Berkshire Hathaway's Charlie Munger, Li Lu, makes no bones about it when he says 'The biggest investment risk is not the volatility of prices, but whether you will suffer a permanent loss of capital.' When we think about how risky a company is, we always like to look at its use of debt, since debt overload can lead to ruin. We can see that Osisko Metals Incorporated (TSE:OM) does use debt in its business. But the more important question is: how much risk is that debt creating?
When Is Debt Dangerous?
Debt assists a business until the business has trouble paying it off, either with new capital or with free cash flow. If things get really bad, the lenders can take control of the business. However, a more frequent (but still costly) occurrence is where a company must issue shares at bargain-basement prices, permanently diluting shareholders, just to shore up its balance sheet. Of course, plenty of companies use debt to fund growth, without any negative consequences. When we think about a company's use of debt, we first look at cash and debt together.
How Much Debt Does Osisko Metals Carry?
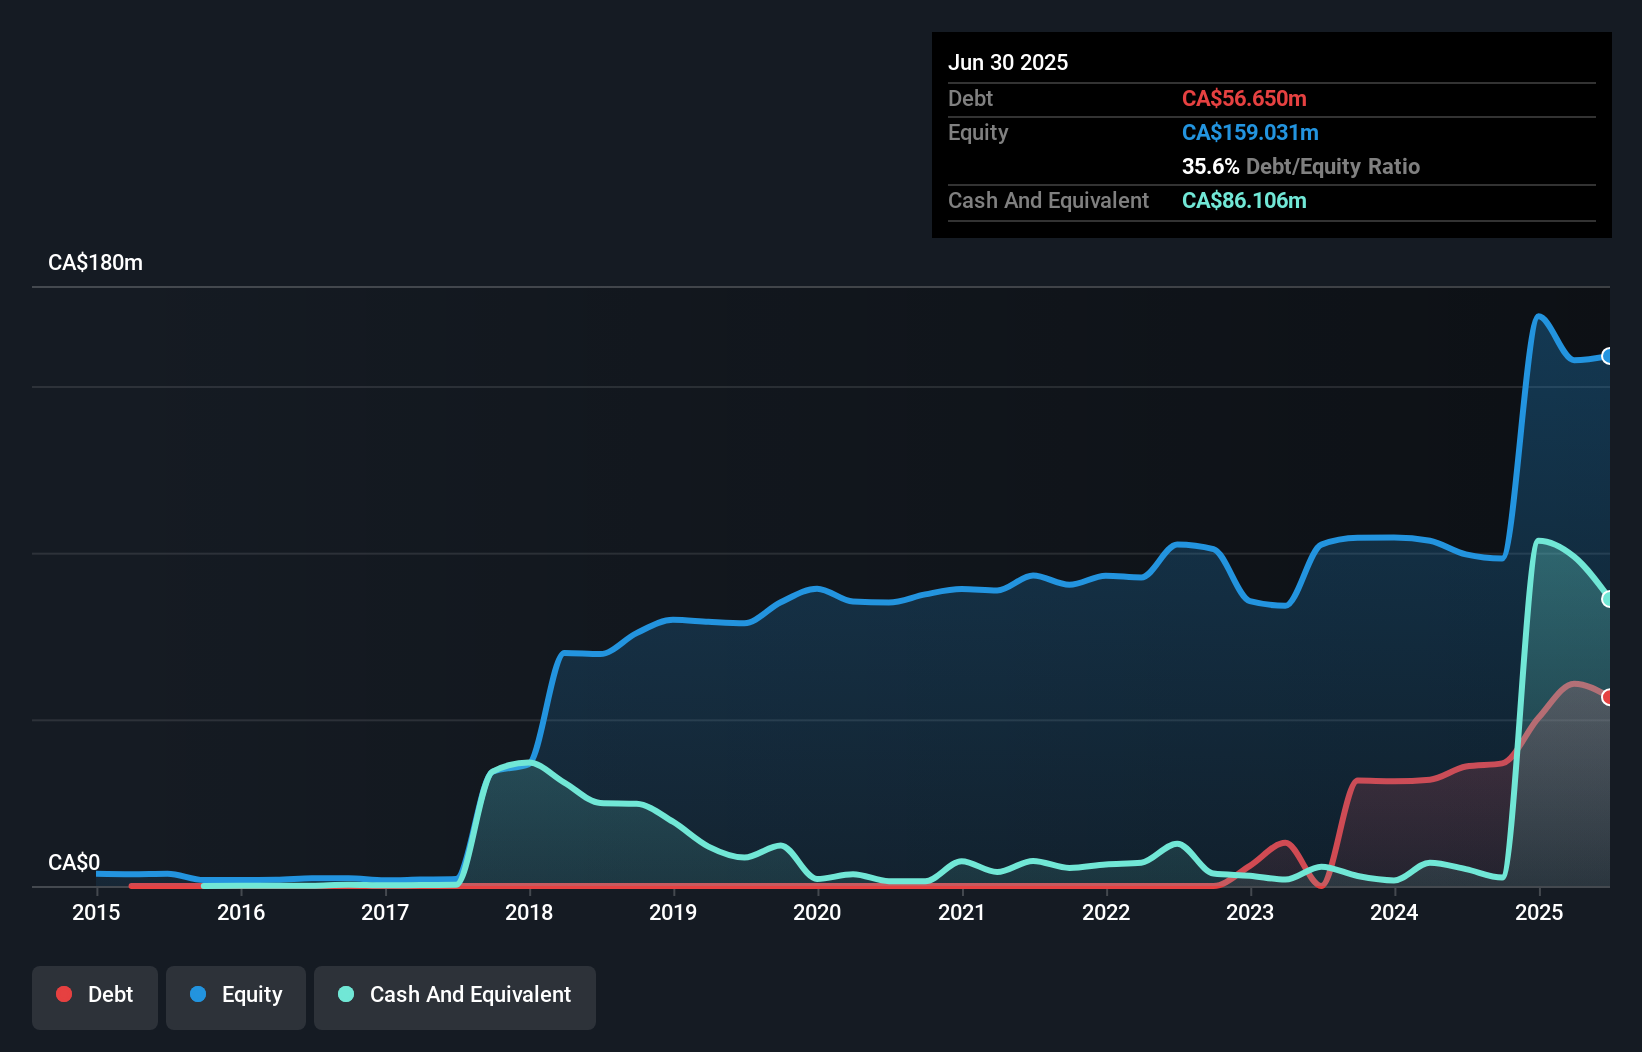
As you can see below, at the end of June 2025, Osisko Metals had CA$56.7m of debt, up from CA$35.9m a year ago. Click the image for more detail. However, its balance sheet shows it holds CA$86.1m in cash, so it actually has CA$29.5m net cash.
A Look At Osisko Metals' Liabilities
According to the last reported balance sheet, Osisko Metals had liabilities of CA$72.6m due within 12 months, and liabilities of CA$11.0m due beyond 12 months. Offsetting this, it had CA$86.1m in cash and CA$1.94m in receivables that were due within 12 months. So it actually has CA$4.50m more liquid assets than total liabilities.
This state of affairs indicates that Osisko Metals' balance sheet looks quite solid, as its total liabilities are just about equal to its liquid assets. So it's very unlikely that the CA$329.4m company is short on cash, but still worth keeping an eye on the balance sheet. Simply put, the fact that Osisko Metals has more cash than debt is arguably a good indication that it can manage its debt safely. The balance sheet is clearly the area to focus on when you are analysing debt. But it is future earnings, more than anything, that will determine Osisko Metals's ability to maintain a healthy balance sheet going forward. So if you're focused on the future you can check out this free report showing analyst profit forecasts.
See our latest analysis for Osisko Metals
Since Osisko Metals has no significant operating revenue, shareholders probably hope it will develop a valuable new mine before too long.
So How Risky Is Osisko Metals?
We have no doubt that loss making companies are, in general, riskier than profitable ones. And the fact is that over the last twelve months Osisko Metals lost money at the earnings before interest and tax (EBIT) line. And over the same period it saw negative free cash outflow of CA$23m and booked a CA$29m accounting loss. But the saving grace is the CA$29.5m on the balance sheet. That kitty means the company can keep spending for growth for at least two years, at current rates. Even though its balance sheet seems sufficiently liquid, debt always makes us a little nervous if a company doesn't produce free cash flow regularly. There's no doubt that we learn most about debt from the balance sheet. But ultimately, every company can contain risks that exist outside of the balance sheet. To that end, you should learn about the 4 warning signs we've spotted with Osisko Metals (including 3 which can't be ignored) .
At the end of the day, it's often better to focus on companies that are free from net debt. You can access our special list of such companies (all with a track record of profit growth). It's free.
The New Payments ETF Is Live on NASDAQ:
Money is moving to real-time rails, and a newly listed ETF now gives investors direct exposure. Fast settlement. Institutional custody. Simple access.
Explore how this launch could reshape portfolios
Sponsored ContentNew: AI Stock Screener & Alerts
Our new AI Stock Screener scans the market every day to uncover opportunities.
• Dividend Powerhouses (3%+ Yield)
• Undervalued Small Caps with Insider Buying
• High growth Tech and AI Companies
Or build your own from over 50 metrics.
Have feedback on this article? Concerned about the content? Get in touch with us directly. Alternatively, email editorial-team (at) simplywallst.com.
This article by Simply Wall St is general in nature. We provide commentary based on historical data and analyst forecasts only using an unbiased methodology and our articles are not intended to be financial advice. It does not constitute a recommendation to buy or sell any stock, and does not take account of your objectives, or your financial situation. We aim to bring you long-term focused analysis driven by fundamental data. Note that our analysis may not factor in the latest price-sensitive company announcements or qualitative material. Simply Wall St has no position in any stocks mentioned.
About TSX:OM
Osisko Metals
Engages in acquiring, exploring, and developing base metals deposits in Canada.
Excellent balance sheet with slight risk.
Market Insights

Weekly Picks

Early mover in a fast growing industry. Likely to experience share price volatility as they scale


A case for CA$31.80 (undiluted), aka 8,616% upside from CA$0.37 (an 86 bagger!).


Moderation and Stabilisation: HOLD: Fair Price based on a 4-year Cycle is $12.08
Recently Updated Narratives

Airbnb Stock: Platform Growth in a World of Saturation and Scrutiny

Adobe Stock: AI-Fueled ARR Growth Pushes Guidance Higher, But Cost Pressures Loom

Thomson Reuters Stock: When Legal Intelligence Becomes Mission-Critical Infrastructure
Popular Narratives


Crazy Undervalued 42 Baggers Silver Play (Active & Running Mine)


NVDA: Expanding AI Demand Will Drive Major Data Center Investments Through 2026

The AI Infrastructure Giant Grows Into Its Valuation
Trending Discussion


