
Legendary fund manager Li Lu (who Charlie Munger backed) once said, 'The biggest investment risk is not the volatility of prices, but whether you will suffer a permanent loss of capital.' So it might be obvious that you need to consider debt, when you think about how risky any given stock is, because too much debt can sink a company. Importantly, Interfor Corporation (TSE:IFP) does carry debt. But the more important question is: how much risk is that debt creating?
When Is Debt A Problem?
Generally speaking, debt only becomes a real problem when a company can't easily pay it off, either by raising capital or with its own cash flow. In the worst case scenario, a company can go bankrupt if it cannot pay its creditors. However, a more usual (but still expensive) situation is where a company must dilute shareholders at a cheap share price simply to get debt under control. Having said that, the most common situation is where a company manages its debt reasonably well - and to its own advantage. When we think about a company's use of debt, we first look at cash and debt together.
View our latest analysis for Interfor
What Is Interfor's Net Debt?
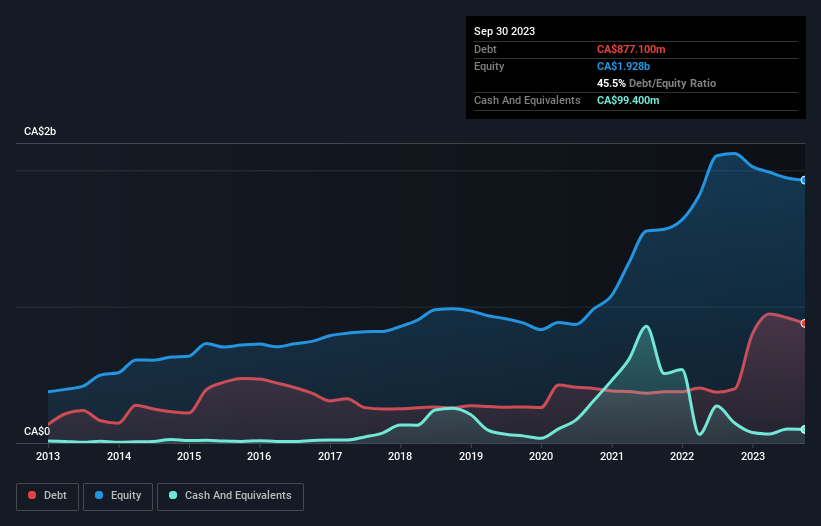
As you can see below, at the end of September 2023, Interfor had CA$877.1m of debt, up from CA$396.4m a year ago. Click the image for more detail. However, because it has a cash reserve of CA$99.4m, its net debt is less, at about CA$777.7m.
How Healthy Is Interfor's Balance Sheet?
According to the last reported balance sheet, Interfor had liabilities of CA$345.4m due within 12 months, and liabilities of CA$1.30b due beyond 12 months. Offsetting these obligations, it had cash of CA$99.4m as well as receivables valued at CA$277.1m due within 12 months. So it has liabilities totalling CA$1.27b more than its cash and near-term receivables, combined.
When you consider that this deficiency exceeds the company's CA$981.6m market capitalization, you might well be inclined to review the balance sheet intently. Hypothetically, extremely heavy dilution would be required if the company were forced to pay down its liabilities by raising capital at the current share price. There's no doubt that we learn most about debt from the balance sheet. But ultimately the future profitability of the business will decide if Interfor can strengthen its balance sheet over time. So if you're focused on the future you can check out this free report showing analyst profit forecasts.
In the last year Interfor had a loss before interest and tax, and actually shrunk its revenue by 25%, to CA$3.3b. That makes us nervous, to say the least.
Caveat Emptor
Not only did Interfor's revenue slip over the last twelve months, but it also produced negative earnings before interest and tax (EBIT). Indeed, it lost a very considerable CA$148m at the EBIT level. Considering that alongside the liabilities mentioned above make us nervous about the company. We'd want to see some strong near-term improvements before getting too interested in the stock. Not least because it had negative free cash flow of CA$107m over the last twelve months. So suffice it to say we consider the stock to be risky. There's no doubt that we learn most about debt from the balance sheet. But ultimately, every company can contain risks that exist outside of the balance sheet. For example - Interfor has 1 warning sign we think you should be aware of.
When all is said and done, sometimes its easier to focus on companies that don't even need debt. Readers can access a list of growth stocks with zero net debt 100% free, right now.
The New Payments ETF Is Live on NASDAQ:
Money is moving to real-time rails, and a newly listed ETF now gives investors direct exposure. Fast settlement. Institutional custody. Simple access.
Explore how this launch could reshape portfolios
Sponsored ContentNew: AI Stock Screener & Alerts
Our new AI Stock Screener scans the market every day to uncover opportunities.
• Dividend Powerhouses (3%+ Yield)
• Undervalued Small Caps with Insider Buying
• High growth Tech and AI Companies
Or build your own from over 50 metrics.
Have feedback on this article? Concerned about the content? Get in touch with us directly. Alternatively, email editorial-team (at) simplywallst.com.
This article by Simply Wall St is general in nature. We provide commentary based on historical data and analyst forecasts only using an unbiased methodology and our articles are not intended to be financial advice. It does not constitute a recommendation to buy or sell any stock, and does not take account of your objectives, or your financial situation. We aim to bring you long-term focused analysis driven by fundamental data. Note that our analysis may not factor in the latest price-sensitive company announcements or qualitative material. Simply Wall St has no position in any stocks mentioned.
About TSX:IFP
Interfor
Produces and sells wood products in Canada, the United States, Japan, China, Taiwan, and internationally.
Undervalued with moderate growth potential.
Similar Companies
Market Insights

Weekly Picks

Early mover in a fast growing industry. Likely to experience share price volatility as they scale


A case for CA$31.80 (undiluted), aka 8,616% upside from CA$0.37 (an 86 bagger!).


Moderation and Stabilisation: HOLD: Fair Price based on a 4-year Cycle is $12.08
Recently Updated Narratives

Airbnb Stock: Platform Growth in a World of Saturation and Scrutiny

Adobe Stock: AI-Fueled ARR Growth Pushes Guidance Higher, But Cost Pressures Loom

Thomson Reuters Stock: When Legal Intelligence Becomes Mission-Critical Infrastructure
Popular Narratives


Crazy Undervalued 42 Baggers Silver Play (Active & Running Mine)


NVDA: Expanding AI Demand Will Drive Major Data Center Investments Through 2026

The AI Infrastructure Giant Grows Into Its Valuation
Trending Discussion


