
Advertisement
- Canada
- /
- Metals and Mining
- /
- TSX:CS
Capstone Copper Corp.'s (TSE:CS) Intrinsic Value Is Potentially 26% Above Its Share Price

Key Insights
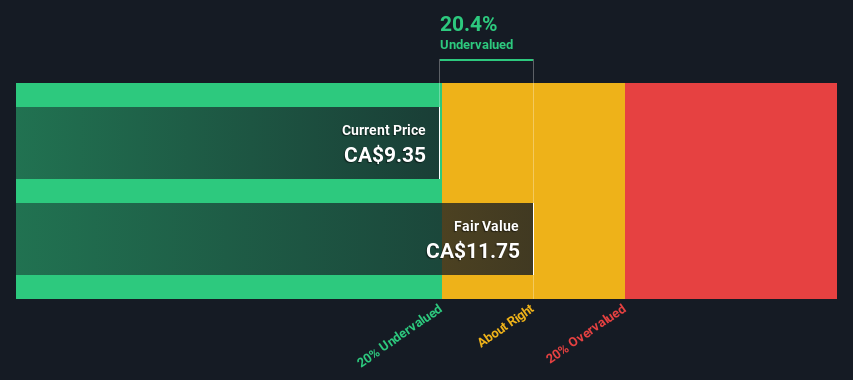
- Capstone Copper's estimated fair value is CA$11.75 based on 2 Stage Free Cash Flow to Equity
- Capstone Copper's CA$9.35 share price signals that it might be 20% undervalued
- Analyst price target for CS is US$9.11 which is 22% below our fair value estimate
Today we'll do a simple run through of a valuation method used to estimate the attractiveness of Capstone Copper Corp. (TSE:CS) as an investment opportunity by taking the forecast future cash flows of the company and discounting them back to today's value. We will use the Discounted Cash Flow (DCF) model on this occasion. There's really not all that much to it, even though it might appear quite complex.
Companies can be valued in a lot of ways, so we would point out that a DCF is not perfect for every situation. If you still have some burning questions about this type of valuation, take a look at the Simply Wall St analysis model.
Check out our latest analysis for Capstone Copper
The Method
We're using the 2-stage growth model, which simply means we take in account two stages of company's growth. In the initial period the company may have a higher growth rate and the second stage is usually assumed to have a stable growth rate. To begin with, we have to get estimates of the next ten years of cash flows. Where possible we use analyst estimates, but when these aren't available we extrapolate the previous free cash flow (FCF) from the last estimate or reported value. We assume companies with shrinking free cash flow will slow their rate of shrinkage, and that companies with growing free cash flow will see their growth rate slow, over this period. We do this to reflect that growth tends to slow more in the early years than it does in later years.
Generally we assume that a dollar today is more valuable than a dollar in the future, so we need to discount the sum of these future cash flows to arrive at a present value estimate:
10-year free cash flow (FCF) forecast
| 2024 | 2025 | 2026 | 2027 | 2028 | 2029 | 2030 | 2031 | 2032 | 2033 | |
| Levered FCF ($, Millions) | US$41.1m | US$414.5m | US$32.0m | -US$93.0m | US$486.0m | US$501.0m | US$514.8m | US$527.8m | US$540.3m | US$552.4m |
| Growth Rate Estimate Source | Analyst x8 | Analyst x7 | Analyst x4 | Analyst x3 | Analyst x1 | Est @ 3.08% | Est @ 2.75% | Est @ 2.53% | Est @ 2.36% | Est @ 2.25% |
| Present Value ($, Millions) Discounted @ 8.0% | US$38.0 | US$355 | US$25.4 | -US$68.4 | US$331 | US$316 | US$301 | US$285 | US$271 | US$256 |
("Est" = FCF growth rate estimated by Simply Wall St)
Present Value of 10-year Cash Flow (PVCF) = US$2.1b
After calculating the present value of future cash flows in the initial 10-year period, we need to calculate the Terminal Value, which accounts for all future cash flows beyond the first stage. The Gordon Growth formula is used to calculate Terminal Value at a future annual growth rate equal to the 5-year average of the 10-year government bond yield of 2.0%. We discount the terminal cash flows to today's value at a cost of equity of 8.0%.
Terminal Value (TV)= FCF2033 × (1 + g) ÷ (r – g) = US$552m× (1 + 2.0%) ÷ (8.0%– 2.0%) = US$9.4b
Present Value of Terminal Value (PVTV)= TV / (1 + r)10= US$9.4b÷ ( 1 + 8.0%)10= US$4.4b
The total value is the sum of cash flows for the next ten years plus the discounted terminal value, which results in the Total Equity Value, which in this case is US$6.5b. To get the intrinsic value per share, we divide this by the total number of shares outstanding. Compared to the current share price of CA$9.4, the company appears a touch undervalued at a 20% discount to where the stock price trades currently. Remember though, that this is just an approximate valuation, and like any complex formula - garbage in, garbage out.
The Assumptions
Now the most important inputs to a discounted cash flow are the discount rate, and of course, the actual cash flows. If you don't agree with these result, have a go at the calculation yourself and play with the assumptions. The DCF also does not consider the possible cyclicality of an industry, or a company's future capital requirements, so it does not give a full picture of a company's potential performance. Given that we are looking at Capstone Copper as potential shareholders, the cost of equity is used as the discount rate, rather than the cost of capital (or weighted average cost of capital, WACC) which accounts for debt. In this calculation we've used 8.0%, which is based on a levered beta of 1.303. Beta is a measure of a stock's volatility, compared to the market as a whole. We get our beta from the industry average beta of globally comparable companies, with an imposed limit between 0.8 and 2.0, which is a reasonable range for a stable business.
SWOT Analysis for Capstone Copper
Strength
- Net debt to equity ratio below 40%.
Weakness
- Interest payments on debt are not well covered.
- Shareholders have been diluted in the past year.
Opportunity
- Expected to breakeven next year.
- Trading below our estimate of fair value by more than 20%.
Threat
- Debt is not well covered by operating cash flow.
Looking Ahead:
Whilst important, the DCF calculation ideally won't be the sole piece of analysis you scrutinize for a company. It's not possible to obtain a foolproof valuation with a DCF model. Rather it should be seen as a guide to "what assumptions need to be true for this stock to be under/overvalued?" For example, changes in the company's cost of equity or the risk free rate can significantly impact the valuation. Why is the intrinsic value higher than the current share price? For Capstone Copper, there are three further elements you should further research:
- Risks: For example, we've discovered 2 warning signs for Capstone Copper that you should be aware of before investing here.
- Management:Have insiders been ramping up their shares to take advantage of the market's sentiment for CS's future outlook? Check out our management and board analysis with insights on CEO compensation and governance factors.
- Other High Quality Alternatives: Do you like a good all-rounder? Explore our interactive list of high quality stocks to get an idea of what else is out there you may be missing!
PS. Simply Wall St updates its DCF calculation for every Canadian stock every day, so if you want to find the intrinsic value of any other stock just search here.
New: AI Stock Screener & Alerts
Our new AI Stock Screener scans the market every day to uncover opportunities.
• Dividend Powerhouses (3%+ Yield)
• Undervalued Small Caps with Insider Buying
• High growth Tech and AI Companies
Or build your own from over 50 metrics.
Have feedback on this article? Concerned about the content? Get in touch with us directly. Alternatively, email editorial-team (at) simplywallst.com.
This article by Simply Wall St is general in nature. We provide commentary based on historical data and analyst forecasts only using an unbiased methodology and our articles are not intended to be financial advice. It does not constitute a recommendation to buy or sell any stock, and does not take account of your objectives, or your financial situation. We aim to bring you long-term focused analysis driven by fundamental data. Note that our analysis may not factor in the latest price-sensitive company announcements or qualitative material. Simply Wall St has no position in any stocks mentioned.
About TSX:CS
Capstone Copper
A copper mining company, mines, explores for, and develops mineral properties in the United States, Chile, and Mexico.
Good value with reasonable growth potential.
Similar Companies
Market Insights


Advertisement
Community Narratives
MicroStrategy: Volatile Gamble or Golden Opportunity?
Fair Value US$663.00|33.3% undervalued
BL
Community Contributor
Emerging Markets and Debt Reduction Will Propel Bath & Body Works Forward
Fair Value US$40.73|23.4% undervalued
ZW
Community Contributor
An amazing opportunity to potentially get a 100 bagger
Fair Value US$10.00|8.5% overvalued
DA
Community Contributor