Advertisement
- Canada
- /
- Metals and Mining
- /
- TSX:AII
A Closer Look at Almonty Industries (TSX:AII) Valuation Following Sangdong Drilling Initiative

Simply Wall St
Reviewed by Kshitija Bhandaru
Almonty Industries (TSX:AII) has kicked off a large-scale drilling campaign at its Sangdong Molybdenum Project in South Korea. The company aims to confirm mineral reserves and respond swiftly to regional supply pressures and higher molybdenum prices.
See our latest analysis for Almonty Industries.
After launching its drilling campaign, Almonty Industries was added to the S&P Global BMI Index and secured strong shareholder support for currency amendments to its warrants and options. The company’s 1-year total shareholder return of 6.2% shows steady long-term gains, suggesting quietly building momentum as strategic projects progress.
If you want more opportunities like this on your radar, consider broadening your search and discover fast growing stocks with high insider ownership
But is the company’s recent progress already reflected in its share price, or do current market conditions present a genuine buying opportunity as Almonty Industries accelerates its growth plans?
Price-to-Book Ratio of 183.8x: Is it justified?
Almonty Industries is trading at a price-to-book ratio of 183.8x, which stands in stark contrast to both its peers and the wider industry average.
The price-to-book ratio compares a company’s market value to its book value and is often used to assess valuation for asset-heavy sectors like metals and mining. A high ratio can signal the market’s strong expectations for future growth or, alternatively, an overvalued stock.
In this case, Almonty’s price-to-book multiple of 183.8x far outpaces both the peer average (10x) and the Canadian metals and mining industry average (2.5x). This steep premium implies the market may be aggressively pricing in anticipated future earnings or strategic developments, but there is a significant disconnect compared to benchmarks, which suggests caution might be warranted.
See what the numbers say about this price — find out in our valuation breakdown.
Result: Price-to-Book Ratio of 183.8x (OVERVALUED)
However, ongoing net losses and a share price trading above analyst targets could limit upside. These are key risks that may temper expectations for rapid gains.
Find out about the key risks to this Almonty Industries narrative.
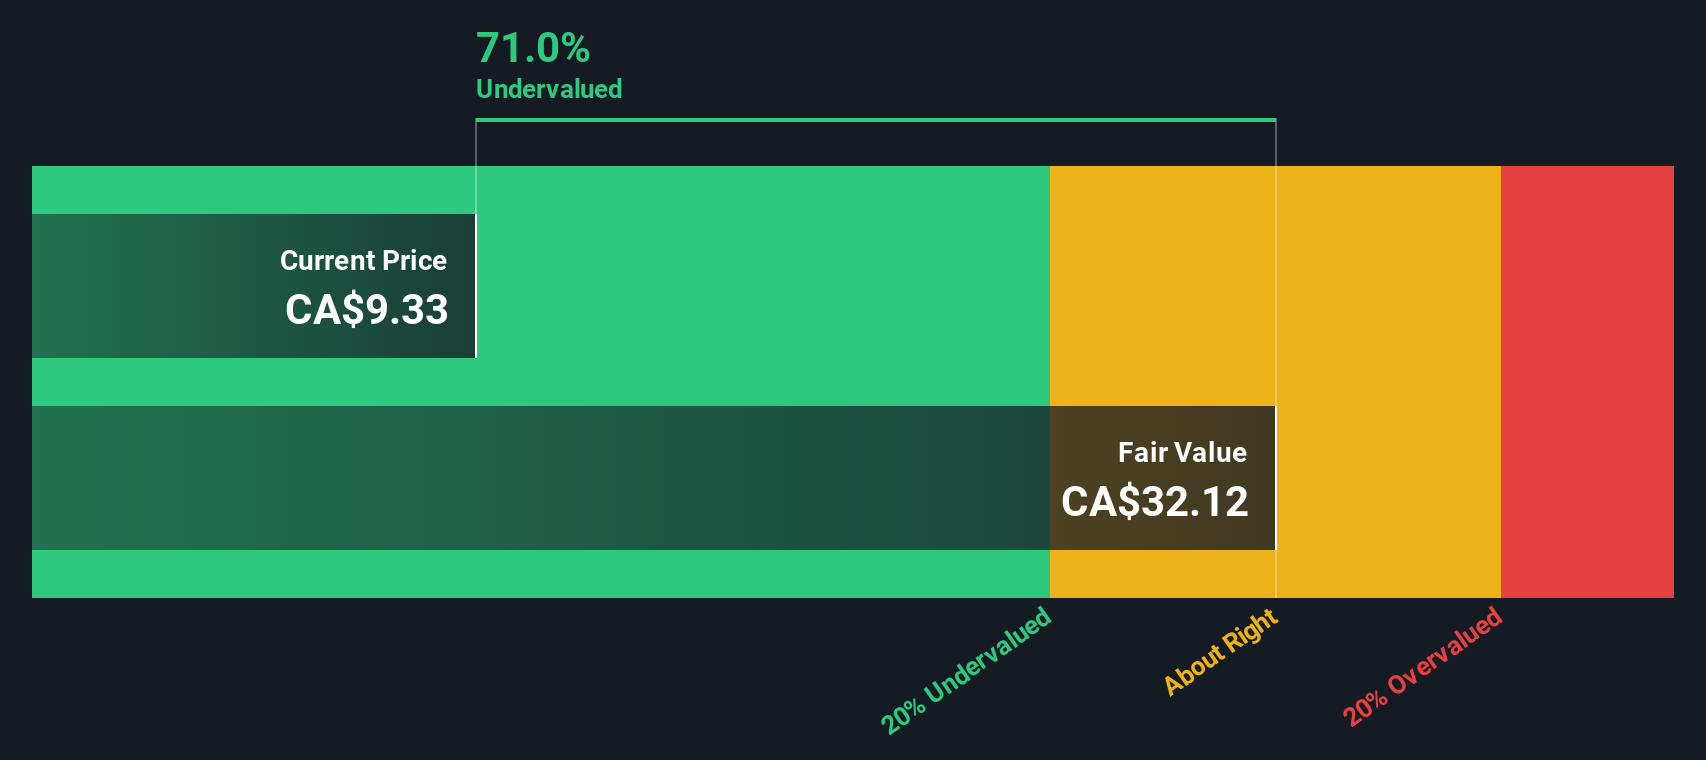
Another View: Discounted Cash Flow Says 'Undervalued'
While the market’s price-to-book multiple makes Almonty Industries look expensive, our DCF model paints a very different picture. Based on projected future cash flows, the DCF approach suggests shares are trading around 73% below fair value, which points to a potential undervaluation. Which perspective will the market trust?
Look into how the SWS DCF model arrives at its fair value.
Simply Wall St performs a discounted cash flow (DCF) on every stock in the world every day (check out Almonty Industries for example). We show the entire calculation in full. You can track the result in your watchlist or portfolio and be alerted when this changes, or use our stock screener to discover undervalued stocks based on their cash flows. If you save a screener we even alert you when new companies match - so you never miss a potential opportunity.
Build Your Own Almonty Industries Narrative
If you have a different perspective or want to interpret the data on your own terms, it takes just a few minutes to create your personal view. Do it your way
A great starting point for your Almonty Industries research is our analysis highlighting 2 key rewards and 1 important warning sign that could impact your investment decision.
Looking for More Investment Ideas?
There are countless other opportunities waiting for smart investors who keep their edge. Don’t let tomorrow’s leaders slip past. Expand your radar and spot fresh potential today.
- Uncover growth potential with these 24 AI penny stocks as artificial intelligence reshapes everything from healthcare to transportation with real-world innovation.
- Secure consistent income by tapping into these 19 dividend stocks with yields > 3%, connecting you with companies offering robust yields above 3%.
- Ride the next wave of fintech by reviewing these 78 cryptocurrency and blockchain stocks that are transforming markets through blockchain and cryptocurrency advancements.
This article by Simply Wall St is general in nature. We provide commentary based on historical data and analyst forecasts only using an unbiased methodology and our articles are not intended to be financial advice. It does not constitute a recommendation to buy or sell any stock, and does not take account of your objectives, or your financial situation. We aim to bring you long-term focused analysis driven by fundamental data. Note that our analysis may not factor in the latest price-sensitive company announcements or qualitative material. Simply Wall St has no position in any stocks mentioned.
New: Manage All Your Stock Portfolios in One Place
We've created the ultimate portfolio companion for stock investors, and it's free.
• Connect an unlimited number of Portfolios and see your total in one currency
• Be alerted to new Warning Signs or Risks via email or mobile
• Track the Fair Value of your stocks
Have feedback on this article? Concerned about the content? Get in touch with us directly. Alternatively, email editorial-team@simplywallst.com
About TSX:AII
Almonty Industries
Engages in mining, processing, and shipping of tungsten concentrate.
Exceptional growth potential and slightly overvalued.
Similar Companies
Market Insights

Advertisement
Community Narratives
The Next Phase of Energy Storage: How NeoVolta Is Tackling America’s Power Crunch
Fair Value US$7.50|35.2% undervalued
MA
Community Contributor
Why EnSilica is Worth Possibly 13x its Current Price
Fair Value UK£5.00|90.0% undervalued
DO
Community Contributor
M&A Activity, Industry Diversification & A Defense Contract Monopoly Will Push BWXT For Healthy Long-Term Growth
Fair Value US$220.00|15.6% undervalued
CL
Community Contributor
A case for Cassiar Gold Corp (TSXV: GLDC) to reach CAD$8-10 before 2030 (X30-37)
Fair Value CA$10.00|97.1% undervalued
AG
Community Contributor