
Advertisement
- Canada
- /
- Healthtech
- /
- TSXV:XYBN
Xybion Digital Inc.'s (CVE:XYBN) Share Price Boosted 80% But Its Business Prospects Need A Lift Too
Xybion Digital Inc. (CVE:XYBN) shareholders have had their patience rewarded with a 80% share price jump in the last month. Unfortunately, the gains of the last month did little to right the losses of the last year with the stock still down 20% over that time.
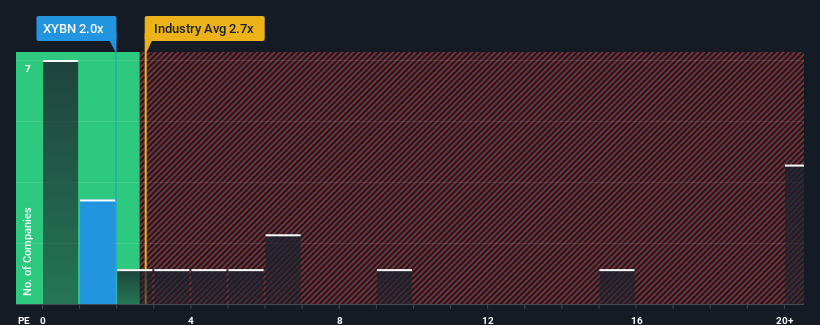
Even after such a large jump in price, Xybion Digital may still look like a strong buying opportunity at present with its price-to-sales (or "P/S") ratio of 2x, considering almost half of all companies in the Healthcare Services industry in Canada have P/S ratios greater than 8x and even P/S higher than 36x aren't out of the ordinary. Although, it's not wise to just take the P/S at face value as there may be an explanation why it's so limited.
See our latest analysis for Xybion Digital
How Has Xybion Digital Performed Recently?
Revenue has risen at a steady rate over the last year for Xybion Digital, which is generally not a bad outcome. Perhaps the market believes the recent revenue performance might fall short of industry figures in the near future, leading to a reduced P/S. Those who are bullish on Xybion Digital will be hoping that this isn't the case, so that they can pick up the stock at a lower valuation.
Although there are no analyst estimates available for Xybion Digital, take a look at this free data-rich visualisation to see how the company stacks up on earnings, revenue and cash flow.What Are Revenue Growth Metrics Telling Us About The Low P/S?
The only time you'd be truly comfortable seeing a P/S as depressed as Xybion Digital's is when the company's growth is on track to lag the industry decidedly.
Taking a look back first, we see that the company managed to grow revenues by a handy 4.6% last year. Revenue has also lifted 21% in aggregate from three years ago, partly thanks to the last 12 months of growth. Accordingly, shareholders would have probably been satisfied with the medium-term rates of revenue growth.
Comparing that to the industry, which is predicted to deliver 13% growth in the next 12 months, the company's momentum is weaker, based on recent medium-term annualised revenue results.
In light of this, it's understandable that Xybion Digital's P/S sits below the majority of other companies. Apparently many shareholders weren't comfortable holding on to something they believe will continue to trail the wider industry.
What We Can Learn From Xybion Digital's P/S?
Xybion Digital's recent share price jump still sees fails to bring its P/S alongside the industry median. Generally, our preference is to limit the use of the price-to-sales ratio to establishing what the market thinks about the overall health of a company.
In line with expectations, Xybion Digital maintains its low P/S on the weakness of its recent three-year growth being lower than the wider industry forecast. At this stage investors feel the potential for an improvement in revenue isn't great enough to justify a higher P/S ratio. If recent medium-term revenue trends continue, it's hard to see the share price experience a reversal of fortunes anytime soon.
There are also other vital risk factors to consider and we've discovered 4 warning signs for Xybion Digital (2 are significant!) that you should be aware of before investing here.
If companies with solid past earnings growth is up your alley, you may wish to see this free collection of other companies with strong earnings growth and low P/E ratios.
New: AI Stock Screener & Alerts
Our new AI Stock Screener scans the market every day to uncover opportunities.
• Dividend Powerhouses (3%+ Yield)
• Undervalued Small Caps with Insider Buying
• High growth Tech and AI Companies
Or build your own from over 50 metrics.
Have feedback on this article? Concerned about the content? Get in touch with us directly. Alternatively, email editorial-team (at) simplywallst.com.
This article by Simply Wall St is general in nature. We provide commentary based on historical data and analyst forecasts only using an unbiased methodology and our articles are not intended to be financial advice. It does not constitute a recommendation to buy or sell any stock, and does not take account of your objectives, or your financial situation. We aim to bring you long-term focused analysis driven by fundamental data. Note that our analysis may not factor in the latest price-sensitive company announcements or qualitative material. Simply Wall St has no position in any stocks mentioned.
About TSXV:XYBN
Xybion Digital
A software-as-a-service company, provides software solutions for life sciences and health systems companies in the United States and internationally.
Excellent balance sheet and slightly overvalued.
Similar Companies
Market Insights

Advertisement
Community Narratives
MicroVision will explode future revenue by 380.37% with a vision towards success
Fair Value US$60|98.4% undervalued
TH
Community Contributor
The Indispensable Artery for a New North American Economy
Fair Value CA$132.87|0.6% undervalued
TI
Community Contributor
Recently Updated Narratives
BL


BlackGoat on Alphabet ·
Alphabet: The Under-appreciated Compounder Hiding in Plain Sight
Fair Value:US$324.481.3% undervalued
75 followersusers have followed this narrative
3 commentsusers have commented on this narrative
1 likeusers have liked this narrative
BE


Bejgal on MINISO Group Holding ·
MINISO's fair value is projected at 26.69 with an anticipated PE ratio shift of 20x
Fair Value:US$26.6926.7% undervalued
45 followersusers have followed this narrative
3 commentsusers have commented on this narrative
0 likesusers have liked this narrative
TI


TickerTickle on Oracle ·
The Quiet Giant That Became AI’s Power Grid
Fair Value:US$389.8147.4% undervalued
9 followersusers have followed this narrative
1 commentusers have commented on this narrative
0 likesusers have liked this narrative
Popular Narratives
OS

oscargarcia on Alphabet ·
The company that turned a verb into a global necessity and basically runs the modern internet, digital ads, smartphones, maps, and AI.
Fair Value:US$3405.9% undervalued
136 followersusers have followed this narrative
6 commentsusers have commented on this narrative
18 likesusers have liked this narrative
TH

TheWallstreetKing on MicroVision ·
MicroVision will explode future revenue by 380.37% with a vision towards success
Fair Value:US$6098.4% undervalued
89 followersusers have followed this narrative
10 commentsusers have commented on this narrative
18 likesusers have liked this narrative
AN


AnalystConsensusTarget on NVIDIA ·
NVDA: Expanding AI Demand Will Drive Major Data Center Investments Through 2026
Fair Value:US$232.7922.6% undervalued
927 followersusers have followed this narrative
6 commentsusers have commented on this narrative
22 likesusers have liked this narrative