- Canada
- /
- Healthcare Services
- /
- TSXV:DOC
CloudMD Software & Services Inc. (CVE:DOC) Stock Rockets 27% As Investors Are Less Pessimistic Than Expected

Those holding CloudMD Software & Services Inc. (CVE:DOC) shares would be relieved that the share price has rebounded 27% in the last thirty days, but it needs to keep going to repair the recent damage it has caused to investor portfolios. Not all shareholders will be feeling jubilant, since the share price is still down a very disappointing 49% in the last twelve months.
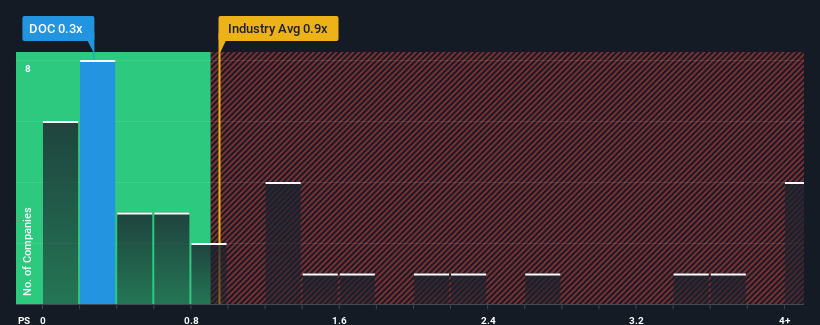
In spite of the firm bounce in price, there still wouldn't be many who think CloudMD Software & Services' price-to-sales (or "P/S") ratio of 0.3x is worth a mention when the median P/S in Canada's Healthcare industry is similar at about 0.7x. However, investors might be overlooking a clear opportunity or potential setback if there is no rational basis for the P/S.
View our latest analysis for CloudMD Software & Services
What Does CloudMD Software & Services' Recent Performance Look Like?
With revenue growth that's inferior to most other companies of late, CloudMD Software & Services has been relatively sluggish. It might be that many expect the uninspiring revenue performance to strengthen positively, which has kept the P/S ratio from falling. If not, then existing shareholders may be a little nervous about the viability of the share price.
Want the full picture on analyst estimates for the company? Then our free report on CloudMD Software & Services will help you uncover what's on the horizon.Do Revenue Forecasts Match The P/S Ratio?
The only time you'd be comfortable seeing a P/S like CloudMD Software & Services' is when the company's growth is tracking the industry closely.
If we review the last year of revenue, the company posted a result that saw barely any deviation from a year ago. Spectacularly, three year revenue growth has ballooned by several orders of magnitude, even though the last 12 months were nothing to write home about. Accordingly, shareholders will be pleased, but also have some serious questions to ponder about the last 12 months.
Turning to the outlook, the next year should bring diminished returns, with revenue decreasing 2.5% as estimated by the two analysts watching the company. That's not great when the rest of the industry is expected to grow by 15%.
In light of this, it's somewhat alarming that CloudMD Software & Services' P/S sits in line with the majority of other companies. Apparently many investors in the company reject the analyst cohort's pessimism and aren't willing to let go of their stock right now. There's a good chance these shareholders are setting themselves up for future disappointment if the P/S falls to levels more in line with the negative growth outlook.
The Key Takeaway
Its shares have lifted substantially and now CloudMD Software & Services' P/S is back within range of the industry median. Generally, our preference is to limit the use of the price-to-sales ratio to establishing what the market thinks about the overall health of a company.
It appears that CloudMD Software & Services currently trades on a higher than expected P/S for a company whose revenues are forecast to decline. When we see a gloomy outlook like this, our immediate thoughts are that the share price is at risk of declining, negatively impacting P/S. If we consider the revenue outlook, the P/S seems to indicate that potential investors may be paying a premium for the stock.
You need to take note of risks, for example - CloudMD Software & Services has 4 warning signs (and 1 which is significant) we think you should know about.
If companies with solid past earnings growth is up your alley, you may wish to see this free collection of other companies with strong earnings growth and low P/E ratios.
The New Payments ETF Is Live on NASDAQ:
Money is moving to real-time rails, and a newly listed ETF now gives investors direct exposure. Fast settlement. Institutional custody. Simple access.
Explore how this launch could reshape portfolios
Sponsored ContentNew: AI Stock Screener & Alerts
Our new AI Stock Screener scans the market every day to uncover opportunities.
• Dividend Powerhouses (3%+ Yield)
• Undervalued Small Caps with Insider Buying
• High growth Tech and AI Companies
Or build your own from over 50 metrics.
Have feedback on this article? Concerned about the content? Get in touch with us directly. Alternatively, email editorial-team (at) simplywallst.com.
This article by Simply Wall St is general in nature. We provide commentary based on historical data and analyst forecasts only using an unbiased methodology and our articles are not intended to be financial advice. It does not constitute a recommendation to buy or sell any stock, and does not take account of your objectives, or your financial situation. We aim to bring you long-term focused analysis driven by fundamental data. Note that our analysis may not factor in the latest price-sensitive company announcements or qualitative material. Simply Wall St has no position in any stocks mentioned.
About TSXV:DOC
CloudMD Software & Services
Offers healthcare services in Canada and the United States.
Low and slightly overvalued.
Similar Companies
Market Insights

Weekly Picks

Early mover in a fast growing industry. Likely to experience share price volatility as they scale


A case for CA$31.80 (undiluted), aka 8,616% upside from CA$0.37 (an 86 bagger!).


Moderation and Stabilisation: HOLD: Fair Price based on a 4-year Cycle is $12.08
Recently Updated Narratives

Automotive Electronics Manufacturer Consistent and Stable

Airbnb Stock: Platform Growth in a World of Saturation and Scrutiny

Adobe Stock: AI-Fueled ARR Growth Pushes Guidance Higher, But Cost Pressures Loom
Popular Narratives


Crazy Undervalued 42 Baggers Silver Play (Active & Running Mine)


NVDA: Expanding AI Demand Will Drive Major Data Center Investments Through 2026

The AI Infrastructure Giant Grows Into Its Valuation
Trending Discussion


