
Advertisement
To avoid investing in a business that's in decline, there's a few financial metrics that can provide early indications of aging. A business that's potentially in decline often shows two trends, a return on capital employed (ROCE) that's declining, and a base of capital employed that's also declining. This reveals that the company isn't compounding shareholder wealth because returns are falling and its net asset base is shrinking. In light of that, from a first glance at Jura Energy (CVE:JEC), we've spotted some signs that it could be struggling, so let's investigate.
What Is Return On Capital Employed (ROCE)?
For those that aren't sure what ROCE is, it measures the amount of pre-tax profits a company can generate from the capital employed in its business. Analysts use this formula to calculate it for Jura Energy:
Return on Capital Employed = Earnings Before Interest and Tax (EBIT) ÷ (Total Assets - Current Liabilities)
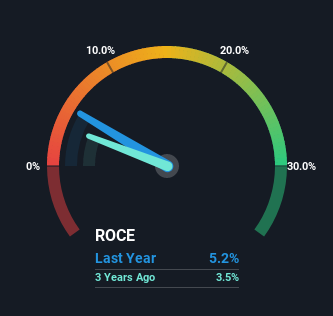
0.052 = US$1.2m ÷ (US$42m - US$19m) (Based on the trailing twelve months to June 2022).
Thus, Jura Energy has an ROCE of 5.2%. In absolute terms, that's a low return and it also under-performs the Oil and Gas industry average of 20%.
Check out the opportunities and risks within the CA Oil and Gas industry.
While the past is not representative of the future, it can be helpful to know how a company has performed historically, which is why we have this chart above. If you want to delve into the historical earnings, revenue and cash flow of Jura Energy, check out these free graphs here.
What Can We Tell From Jura Energy's ROCE Trend?
The trend of returns that Jura Energy is generating are raising some concerns. To be more specific, today's ROCE was 12% five years ago but has since fallen to 5.2%. What's equally concerning is that the amount of capital deployed in the business has shrunk by 27% over that same period. The fact that both are shrinking is an indication that the business is going through some tough times. Typically businesses that exhibit these characteristics aren't the ones that tend to multiply over the long term, because statistically speaking, they've already gone through the growth phase of their life cycle.
Another thing to note, Jura Energy has a high ratio of current liabilities to total assets of 46%. This can bring about some risks because the company is basically operating with a rather large reliance on its suppliers or other sorts of short-term creditors. While it's not necessarily a bad thing, it can be beneficial if this ratio is lower.
The Bottom Line
In short, lower returns and decreasing amounts capital employed in the business doesn't fill us with confidence. Long term shareholders who've owned the stock over the last five years have experienced a 48% depreciation in their investment, so it appears the market might not like these trends either. That being the case, unless the underlying trends revert to a more positive trajectory, we'd consider looking elsewhere.
One more thing to note, we've identified 3 warning signs with Jura Energy and understanding these should be part of your investment process.
While Jura Energy may not currently earn the highest returns, we've compiled a list of companies that currently earn more than 25% return on equity. Check out this free list here.
New: Manage All Your Stock Portfolios in One Place
We've created the ultimate portfolio companion for stock investors, and it's free.
• Connect an unlimited number of Portfolios and see your total in one currency
• Be alerted to new Warning Signs or Risks via email or mobile
• Track the Fair Value of your stocks
Have feedback on this article? Concerned about the content? Get in touch with us directly. Alternatively, email editorial-team (at) simplywallst.com.
This article by Simply Wall St is general in nature. We provide commentary based on historical data and analyst forecasts only using an unbiased methodology and our articles are not intended to be financial advice. It does not constitute a recommendation to buy or sell any stock, and does not take account of your objectives, or your financial situation. We aim to bring you long-term focused analysis driven by fundamental data. Note that our analysis may not factor in the latest price-sensitive company announcements or qualitative material. Simply Wall St has no position in any stocks mentioned.
About TSXV:JEC
Jura Energy
Engages in the exploration, extraction, and production of oil and natural gas properties in Pakistan and Canada.
Good value with slight risk.
Market Insights

Advertisement
Community Narratives
Finding The True Value Of A Logistics Powerhouse
Fair Value US$95.21|8.6% undervalued
NV
Community Contributor
Paradigm Biopharmaceuticals Will Lead Osteoarthritis Treatment with Zilosul's FDA Success
Fair Value AU$5.50|92.1% undervalued
AM
Community Contributor
Barrick Mining (ABX:CA): A Gold Hedge against a U.S. Shutdown
Fair Value CA$60.00|25.6% undervalued
GM
Community Contributor