Advertisement
- Canada
- /
- Oil and Gas
- /
- TSXV:FUU
TSX Penny Stocks Spotlight: Coelacanth Energy And 2 More Promising Picks

Simply Wall St
Reviewed by Simply Wall St
The Canadian market has shown resilience recently, with the TSX rising over 2% amid ongoing global tariff uncertainties and stable interest rates from the Bank of Canada. In this climate, identifying stocks with strong fundamentals becomes crucial for investors seeking growth opportunities. Penny stocks, despite their somewhat outdated moniker, remain a relevant investment area as they often represent smaller or newer companies that can offer hidden value and potential for significant returns when backed by solid financials.
Top 10 Penny Stocks In Canada
| Name | Share Price | Market Cap | Rewards & Risks |
| Westbridge Renewable Energy (TSXV:WEB) | CA$0.60 | CA$56.64M | ✅ 4 ⚠️ 4 View Analysis > |
| NTG Clarity Networks (TSXV:NCI) | CA$1.56 | CA$66.86M | ✅ 4 ⚠️ 2 View Analysis > |
| Thor Explorations (TSXV:THX) | CA$0.61 | CA$399.18M | ✅ 3 ⚠️ 2 View Analysis > |
| Orezone Gold (TSX:ORE) | CA$1.22 | CA$627.66M | ✅ 4 ⚠️ 1 View Analysis > |
| Amerigo Resources (TSX:ARG) | CA$1.77 | CA$287.36M | ✅ 2 ⚠️ 2 View Analysis > |
| PetroTal (TSX:TAL) | CA$0.55 | CA$512.47M | ✅ 4 ⚠️ 3 View Analysis > |
| Pulse Seismic (TSX:PSD) | CA$2.50 | CA$128M | ✅ 1 ⚠️ 2 View Analysis > |
| McCoy Global (TSX:MCB) | CA$3.36 | CA$91.06M | ✅ 3 ⚠️ 2 View Analysis > |
| Findev (TSXV:FDI) | CA$0.49 | CA$13.89M | ✅ 2 ⚠️ 3 View Analysis > |
| BluMetric Environmental (TSXV:BLM) | CA$1.21 | CA$42.83M | ✅ 2 ⚠️ 4 View Analysis > |
Click here to see the full list of 924 stocks from our TSX Penny Stocks screener.
Let's uncover some gems from our specialized screener.
Coelacanth Energy (TSXV:CEI)
Simply Wall St Financial Health Rating: ★★★★☆☆
Overview: Coelacanth Energy Inc. is an oil and natural gas company focused on acquiring, developing, exploring, and producing oil and natural gas reserves in northeastern British Columbia, Canada with a market cap of CA$415.12 million.
Operations: The company's revenue is primarily derived from its oil and gas exploration and production activities, amounting to CA$10.65 million.
Market Cap: CA$415.12M
Coelacanth Energy, with a market cap of CA$415.12 million, focuses on oil and gas exploration in northeastern British Columbia. Despite being unprofitable, the company saw its revenue grow by 247% last year to CA$10.65 million. It has no debt and short-term assets of CA$49.9 million comfortably cover both short- and long-term liabilities. However, Coelacanth faces challenges with less than a year's cash runway based on current free cash flow trends and recent significant insider selling raises concerns about internal confidence in future prospects. Analysts anticipate substantial stock price growth despite these hurdles.
- Click to explore a detailed breakdown of our findings in Coelacanth Energy's financial health report.
- Assess Coelacanth Energy's future earnings estimates with our detailed growth reports.
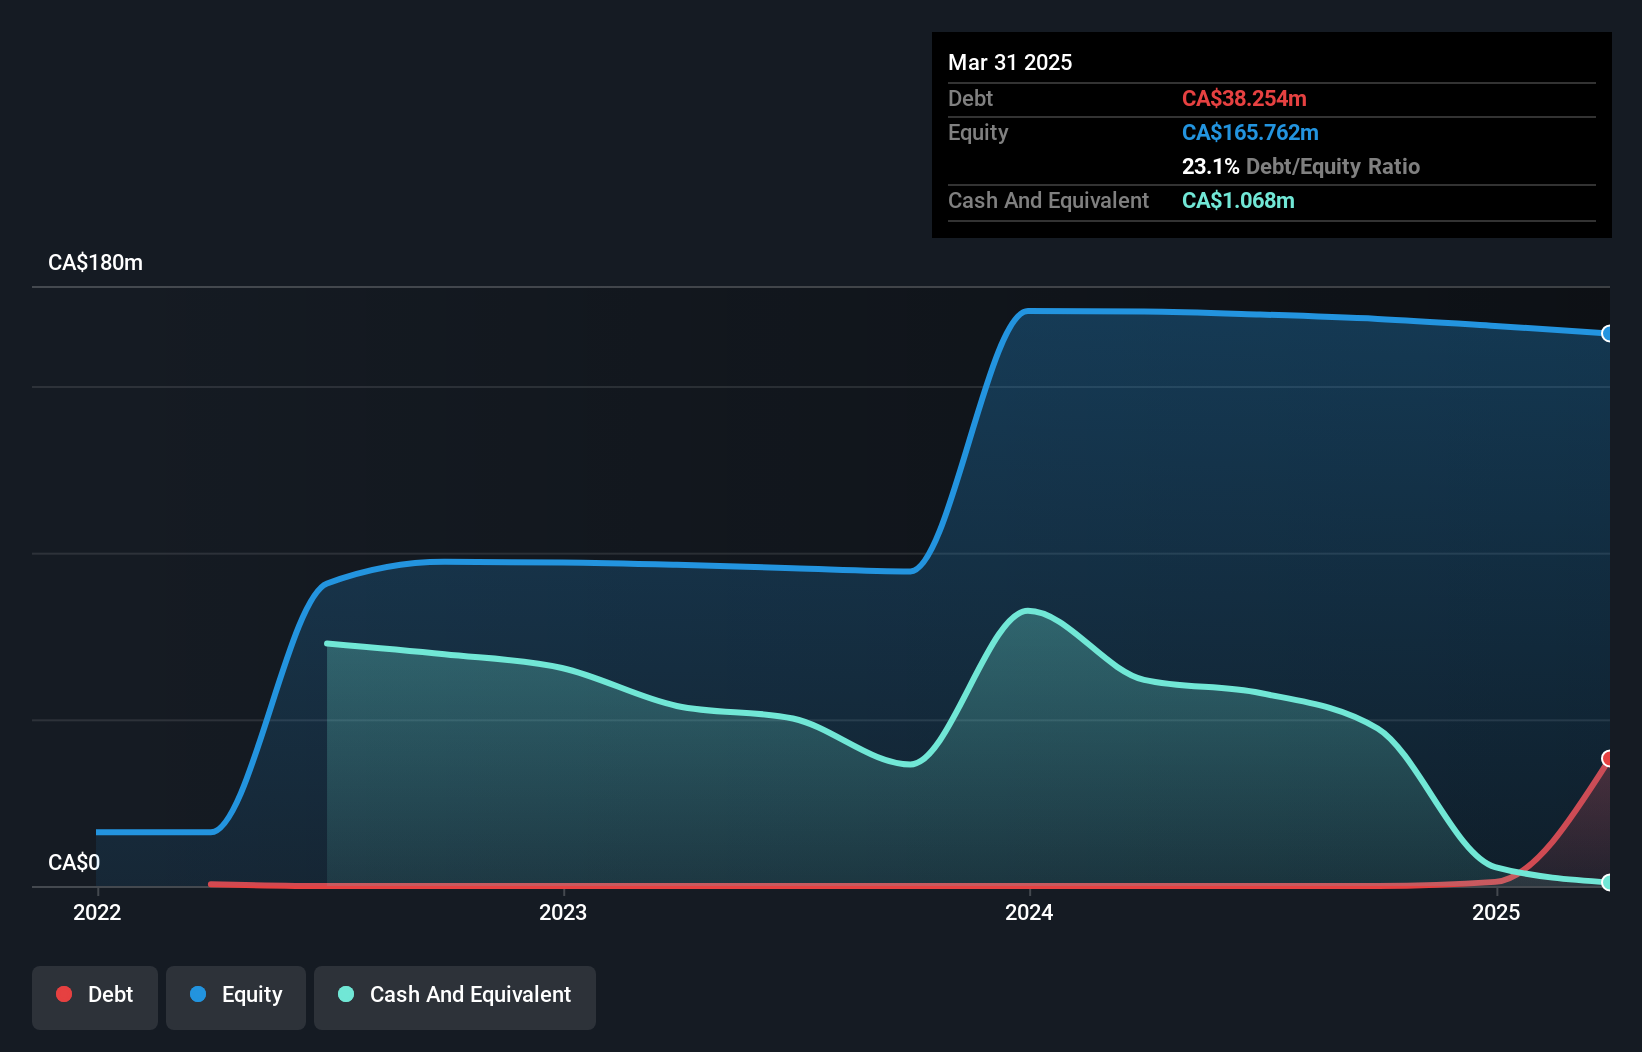
F3 Uranium (TSXV:FUU)
Simply Wall St Financial Health Rating: ★★★★★☆
Overview: F3 Uranium Corp. is involved in acquiring and exploring mineral properties in Canada, with a market cap of CA$98.67 million.
Operations: F3 Uranium Corp. currently does not report any revenue segments.
Market Cap: CA$98.67M
F3 Uranium, with a market cap of CA$98.67 million, is pre-revenue and currently unprofitable. The company recently announced a private placement to raise CA$7.01 million, which could help extend its cash runway beyond the current seven months forecasted based on free cash flow estimates. Despite an increase in its debt-to-equity ratio over five years, F3 maintains more cash than total debt and has short-term assets exceeding liabilities. Recent exploration activities have shown promising initial results with high radioactivity levels detected at new sites, although these findings are preliminary indicators of potential uranium presence rather than confirmed mineral grades.
- Jump into the full analysis health report here for a deeper understanding of F3 Uranium.
- Learn about F3 Uranium's future growth trajectory here.

Majestic Gold (TSXV:MJS)
Simply Wall St Financial Health Rating: ★★★★★★
Overview: Majestic Gold Corp. is a mining company engaged in the exploration, development, and operation of mining properties in China, with a market cap of CA$125.12 million.
Operations: The company's revenue of $70.95 million is derived from its activities in exploring, developing, and operating mining properties.
Market Cap: CA$125.12M
Majestic Gold Corp., with a market cap of CA$125.12 million, has shown steady growth in its financial performance. The company reported a revenue increase to US$70.95 million for 2024, up from the previous year, alongside a net income rise to US$9.93 million. Despite operating in the volatile mining sector, Majestic Gold has maintained stable weekly volatility and improved profit margins slightly over the past year. The absence of debt enhances its financial stability, while short-term assets comfortably cover both short and long-term liabilities. Recent production results indicate modest growth amidst ongoing expansion efforts at their SJG open pit site.
- Get an in-depth perspective on Majestic Gold's performance by reading our balance sheet health report here.
- Review our historical performance report to gain insights into Majestic Gold's track record.

Next Steps
- Embark on your investment journey to our 924 TSX Penny Stocks selection here.
- Contemplating Other Strategies? Uncover 13 companies that survived and thrived after COVID and have the right ingredients to survive Trump's tariffs.
This article by Simply Wall St is general in nature. We provide commentary based on historical data and analyst forecasts only using an unbiased methodology and our articles are not intended to be financial advice. It does not constitute a recommendation to buy or sell any stock, and does not take account of your objectives, or your financial situation. We aim to bring you long-term focused analysis driven by fundamental data. Note that our analysis may not factor in the latest price-sensitive company announcements or qualitative material. Simply Wall St has no position in any stocks mentioned.
New: AI Stock Screener & Alerts
Our new AI Stock Screener scans the market every day to uncover opportunities.
• Dividend Powerhouses (3%+ Yield)
• Undervalued Small Caps with Insider Buying
• High growth Tech and AI Companies
Or build your own from over 50 metrics.
Have feedback on this article? Concerned about the content? Get in touch with us directly. Alternatively, email editorial-team@simplywallst.com
About TSXV:FUU
F3 Uranium
Engages in the acquisition and exploration of mineral properties in Canada.
Moderate risk with adequate balance sheet.
Market Insights

Advertisement
Community Narratives
MINISO's fair value is projected at 26.69 with an anticipated PE ratio shift of 20x
Fair Value US$24.03|11.4% undervalued
BE
Community Contributor
Procter & Gamble: A Dividend Giant Facing Slowing Growth
Fair Value US$119.81|23.5% overvalued
AN
Community Contributor
Eli Lilly's Future Growth Driven by Tirzepatide and Favorable Market Conditions
Fair Value US$1.19k|14.0% undervalued
EA
Community Contributor