
Advertisement
- Canada
- /
- Oil and Gas
- /
- TSX:VET
Take Care Before Jumping Onto Vermilion Energy Inc. (TSE:VET) Even Though It's 29% Cheaper
To the annoyance of some shareholders, Vermilion Energy Inc. (TSE:VET) shares are down a considerable 29% in the last month, which continues a horrid run for the company. The recent drop completes a disastrous twelve months for shareholders, who are sitting on a 55% loss during that time.
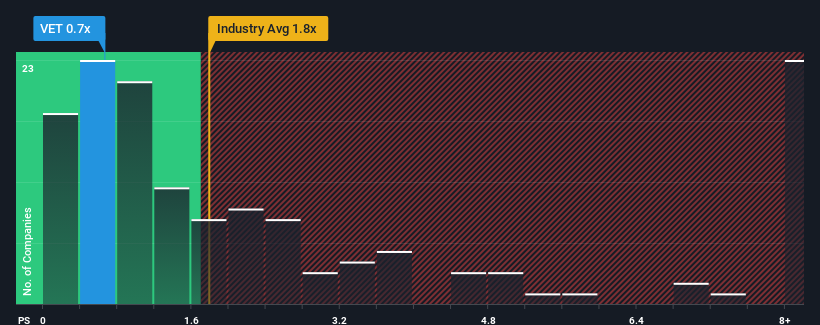
Since its price has dipped substantially, Vermilion Energy may be sending bullish signals at the moment with its price-to-sales (or "P/S") ratio of 0.7x, since almost half of all companies in the Oil and Gas industry in Canada have P/S ratios greater than 1.8x and even P/S higher than 5x are not unusual. Although, it's not wise to just take the P/S at face value as there may be an explanation why it's limited.
See our latest analysis for Vermilion Energy
How Has Vermilion Energy Performed Recently?
Vermilion Energy hasn't been tracking well recently as its declining revenue compares poorly to other companies, which have seen some growth in their revenues on average. It seems that many are expecting the poor revenue performance to persist, which has repressed the P/S ratio. So while you could say the stock is cheap, investors will be looking for improvement before they see it as good value.
If you'd like to see what analysts are forecasting going forward, you should check out our free report on Vermilion Energy .Do Revenue Forecasts Match The Low P/S Ratio?
Vermilion Energy's P/S ratio would be typical for a company that's only expected to deliver limited growth, and importantly, perform worse than the industry.
Taking a look back first, the company's revenue growth last year wasn't something to get excited about as it posted a disappointing decline of 1.5%. As a result, revenue from three years ago have also fallen 4.8% overall. Accordingly, shareholders would have felt downbeat about the medium-term rates of revenue growth.
Looking ahead now, revenue is anticipated to climb by 8.8% each year during the coming three years according to the five analysts following the company. That's shaping up to be materially higher than the 3.4% per annum growth forecast for the broader industry.
With this in consideration, we find it intriguing that Vermilion Energy's P/S sits behind most of its industry peers. Apparently some shareholders are doubtful of the forecasts and have been accepting significantly lower selling prices.
The Final Word
Vermilion Energy's P/S has taken a dip along with its share price. We'd say the price-to-sales ratio's power isn't primarily as a valuation instrument but rather to gauge current investor sentiment and future expectations.
Vermilion Energy's analyst forecasts revealed that its superior revenue outlook isn't contributing to its P/S anywhere near as much as we would have predicted. There could be some major risk factors that are placing downward pressure on the P/S ratio. It appears the market could be anticipating revenue instability, because these conditions should normally provide a boost to the share price.
It's always necessary to consider the ever-present spectre of investment risk. We've identified 2 warning signs with Vermilion Energy (at least 1 which is significant), and understanding them should be part of your investment process.
It's important to make sure you look for a great company, not just the first idea you come across. So if growing profitability aligns with your idea of a great company, take a peek at this free list of interesting companies with strong recent earnings growth (and a low P/E).
New: Manage All Your Stock Portfolios in One Place
We've created the ultimate portfolio companion for stock investors, and it's free.
• Connect an unlimited number of Portfolios and see your total in one currency
• Be alerted to new Warning Signs or Risks via email or mobile
• Track the Fair Value of your stocks
Have feedback on this article? Concerned about the content? Get in touch with us directly. Alternatively, email editorial-team (at) simplywallst.com.
This article by Simply Wall St is general in nature. We provide commentary based on historical data and analyst forecasts only using an unbiased methodology and our articles are not intended to be financial advice. It does not constitute a recommendation to buy or sell any stock, and does not take account of your objectives, or your financial situation. We aim to bring you long-term focused analysis driven by fundamental data. Note that our analysis may not factor in the latest price-sensitive company announcements or qualitative material. Simply Wall St has no position in any stocks mentioned.
About TSX:VET
Vermilion Energy
An oil and gas producer, focuses on the acquisition, exploration, development, and optimization of producing properties in North America, Europe, and Australia.
Undervalued with adequate balance sheet.
Similar Companies
Market Insights

Advertisement
Community Narratives
Quality at a Premium. A time to watch, not to buy?
Fair Value US$154.56|27.6% undervalued
DA
Community Contributor
GRAB: The Super-App at the Heart of Southeast Asia’s Digital Boom
Fair Value US$8.20|22.1% undervalued
BL
Community Contributor
Verve Group to Surge with 51.61% Revenue Growth
Fair Value €6.00|60.0% undervalued
ME
Community Contributor