

Warren Buffett famously said, 'Volatility is far from synonymous with risk.' It's only natural to consider a company's balance sheet when you examine how risky it is, since debt is often involved when a business collapses. As with many other companies Vermilion Energy Inc. (TSE:VET) makes use of debt. But is this debt a concern to shareholders?
What Risk Does Debt Bring?
Debt assists a business until the business has trouble paying it off, either with new capital or with free cash flow. In the worst case scenario, a company can go bankrupt if it cannot pay its creditors. While that is not too common, we often do see indebted companies permanently diluting shareholders because lenders force them to raise capital at a distressed price. Of course, plenty of companies use debt to fund growth, without any negative consequences. The first step when considering a company's debt levels is to consider its cash and debt together.
Check out our latest analysis for Vermilion Energy
What Is Vermilion Energy's Net Debt?
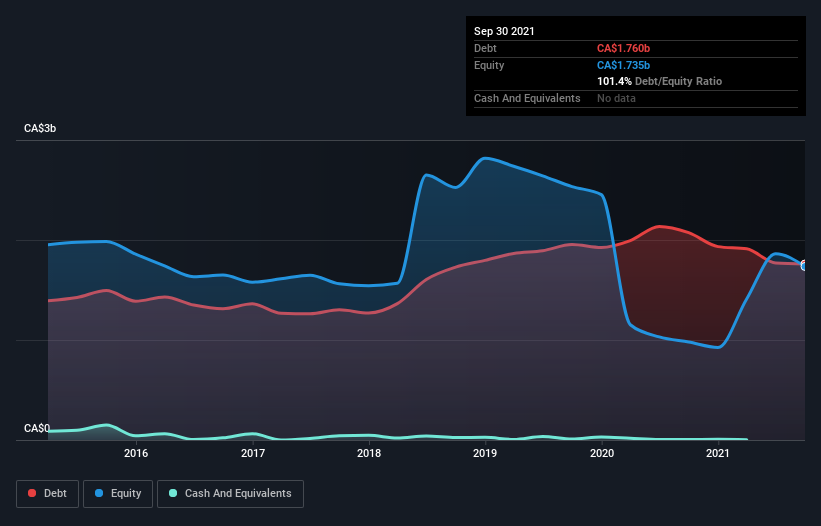
You can click the graphic below for the historical numbers, but it shows that Vermilion Energy had CA$1.76b of debt in September 2021, down from CA$2.07b, one year before. Net debt is about the same, since the it doesn't have much cash.
How Strong Is Vermilion Energy's Balance Sheet?
The latest balance sheet data shows that Vermilion Energy had liabilities of CA$896.0m due within a year, and liabilities of CA$3.12b falling due after that. Offsetting these obligations, it had cash of CA$3.60m as well as receivables valued at CA$281.6m due within 12 months. So its liabilities outweigh the sum of its cash and (near-term) receivables by CA$3.73b.
This deficit is considerable relative to its market capitalization of CA$3.96b, so it does suggest shareholders should keep an eye on Vermilion Energy's use of debt. This suggests shareholders would be heavily diluted if the company needed to shore up its balance sheet in a hurry. There's no doubt that we learn most about debt from the balance sheet. But ultimately the future profitability of the business will decide if Vermilion Energy can strengthen its balance sheet over time. So if you're focused on the future you can check out this free report showing analyst profit forecasts.
Over 12 months, Vermilion Energy reported revenue of CA$1.5b, which is a gain of 37%, although it did not report any earnings before interest and tax. With any luck the company will be able to grow its way to profitability.
Caveat Emptor
Even though Vermilion Energy managed to grow its top line quite deftly, the cold hard truth is that it is losing money on the EBIT line. Indeed, it lost CA$278m at the EBIT level. When we look at that and recall the liabilities on its balance sheet, relative to cash, it seems unwise to us for the company to have any debt. Quite frankly we think the balance sheet is far from match-fit, although it could be improved with time. On the bright side, we note that trailing twelve month EBIT is worse than the free cash flow of CA$321m and the profit of CA$746m. So one might argue that there's still a chance it can get things on the right track. When analysing debt levels, the balance sheet is the obvious place to start. However, not all investment risk resides within the balance sheet - far from it. These risks can be hard to spot. Every company has them, and we've spotted 5 warning signs for Vermilion Energy (of which 1 makes us a bit uncomfortable!) you should know about.
If, after all that, you're more interested in a fast growing company with a rock-solid balance sheet, then check out our list of net cash growth stocks without delay.
New: Manage All Your Stock Portfolios in One Place
We've created the ultimate portfolio companion for stock investors, and it's free.
• Connect an unlimited number of Portfolios and see your total in one currency
• Be alerted to new Warning Signs or Risks via email or mobile
• Track the Fair Value of your stocks
Have feedback on this article? Concerned about the content? Get in touch with us directly. Alternatively, email editorial-team (at) simplywallst.com.
This article by Simply Wall St is general in nature. We provide commentary based on historical data and analyst forecasts only using an unbiased methodology and our articles are not intended to be financial advice. It does not constitute a recommendation to buy or sell any stock, and does not take account of your objectives, or your financial situation. We aim to bring you long-term focused analysis driven by fundamental data. Note that our analysis may not factor in the latest price-sensitive company announcements or qualitative material. Simply Wall St has no position in any stocks mentioned.
About TSX:VET
Vermilion Energy
An oil and gas producer, focuses on the acquisition, exploration, development, and optimization of producing properties in North America, Europe, and Australia.
Undervalued low.
Similar Companies
Market Insights

Community Narratives

