- Canada
- /
- Energy Services
- /
- TSX:TOT
Total Energy Services' (TSE:TOT) Stock Price Has Reduced 75% In The Past Three Years


It is a pleasure to report that the Total Energy Services Inc. (TSE:TOT) is up 53% in the last quarter. But that doesn't change the fact that the returns over the last three years have been stomach churning. The share price has sunk like a leaky ship, down 75% in that time. Arguably, the recent bounce is to be expected after such a bad drop. Of course the real question is whether the business can sustain a turnaround.
View our latest analysis for Total Energy Services
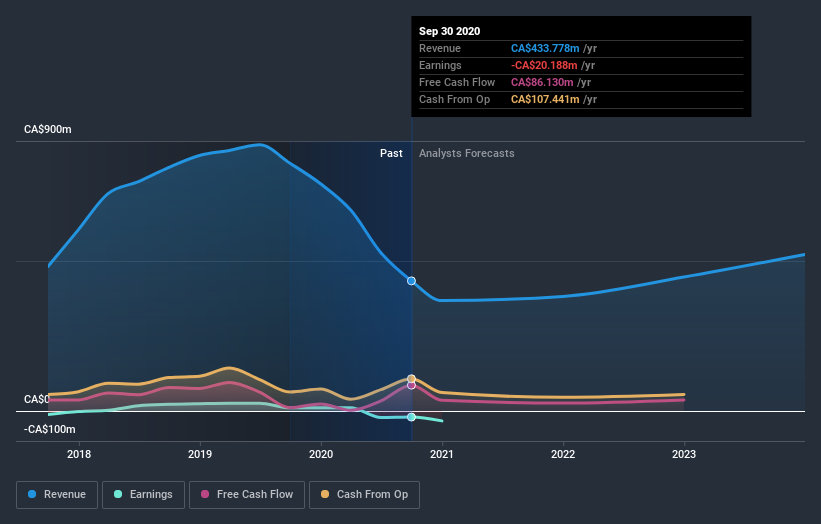
Total Energy Services wasn't profitable in the last twelve months, it is unlikely we'll see a strong correlation between its share price and its earnings per share (EPS). Arguably revenue is our next best option. Generally speaking, companies without profits are expected to grow revenue every year, and at a good clip. That's because it's hard to be confident a company will be sustainable if revenue growth is negligible, and it never makes a profit.
In the last three years Total Energy Services saw its revenue shrink by 2.7% per year. That's not what investors generally want to see. Having said that the 21% annualized share price decline highlights the risk of investing in unprofitable companies. This business clearly needs to grow revenues if it is to perform as investors hope. Don't let a share price decline ruin your calm. You make better decisions when you're calm.
The image below shows how earnings and revenue have tracked over time (if you click on the image you can see greater detail).
It's good to see that there was some significant insider buying in the last three months. That's a positive. That said, we think earnings and revenue growth trends are even more important factors to consider. So we recommend checking out this free report showing consensus forecasts
A Different Perspective
Investors in Total Energy Services had a tough year, with a total loss of 44%, against a market gain of about 5.9%. However, keep in mind that even the best stocks will sometimes underperform the market over a twelve month period. Regrettably, last year's performance caps off a bad run, with the shareholders facing a total loss of 11% per year over five years. Generally speaking long term share price weakness can be a bad sign, though contrarian investors might want to research the stock in hope of a turnaround. While it is well worth considering the different impacts that market conditions can have on the share price, there are other factors that are even more important. Take risks, for example - Total Energy Services has 2 warning signs we think you should be aware of.
If you like to buy stocks alongside management, then you might just love this free list of companies. (Hint: insiders have been buying them).
Please note, the market returns quoted in this article reflect the market weighted average returns of stocks that currently trade on CA exchanges.
If you’re looking to trade Total Energy Services, open an account with the lowest-cost* platform trusted by professionals, Interactive Brokers. Their clients from over 200 countries and territories trade stocks, options, futures, forex, bonds and funds worldwide from a single integrated account. Promoted
If you're looking to trade Total Energy Services, open an account with the lowest-cost platform trusted by professionals, Interactive Brokers.
With clients in over 200 countries and territories, and access to 160 markets, IBKR lets you trade stocks, options, futures, forex, bonds and funds from a single integrated account.
Enjoy no hidden fees, no account minimums, and FX conversion rates as low as 0.03%, far better than what most brokers offer.
Sponsored ContentValuation is complex, but we're here to simplify it.
Discover if Total Energy Services might be undervalued or overvalued with our detailed analysis, featuring fair value estimates, potential risks, dividends, insider trades, and its financial condition.
Access Free AnalysisThis article by Simply Wall St is general in nature. It does not constitute a recommendation to buy or sell any stock, and does not take account of your objectives, or your financial situation. We aim to bring you long-term focused analysis driven by fundamental data. Note that our analysis may not factor in the latest price-sensitive company announcements or qualitative material. Simply Wall St has no position in any stocks mentioned.
*Interactive Brokers Rated Lowest Cost Broker by StockBrokers.com Annual Online Review 2020
Have feedback on this article? Concerned about the content? Get in touch with us directly. Alternatively, email editorial-team (at) simplywallst.com.
About TSX:TOT
Total Energy Services
Operates as an energy services company primarily in Canada, the United States, Australia, and internationally.
Flawless balance sheet with solid track record and pays a dividend.
Similar Companies
Market Insights

Community Narratives

