
Advertisement
Want to participate in a short research study? Help shape the future of investing tools and you could win a $250 gift card!
Many investors are still learning about the various metrics that can be useful when analysing a stock. This article is for those who would like to learn about Return On Equity (ROE). To keep the lesson grounded in practicality, we'll use ROE to better understand Suncor Energy Inc. (TSE:SU).
Over the last twelve months Suncor Energy has recorded a ROE of 7.5%. Another way to think of that is that for every CA$1 worth of equity in the company, it was able to earn CA$0.075.
View our latest analysis for Suncor Energy
How Do I Calculate Return On Equity?
The formula for ROE is:
Return on Equity = Net Profit ÷ Shareholders' Equity
Or for Suncor Energy:
7.5% = CA$3.3b ÷ CA$44b (Based on the trailing twelve months to December 2018.)
Most readers would understand what net profit is, but it’s worth explaining the concept of shareholders’ equity. It is the capital paid in by shareholders, plus any retained earnings. The easiest way to calculate shareholders' equity is to subtract the company's total liabilities from the total assets.
What Does ROE Signify?
ROE measures a company's profitability against the profit it retains, and any outside investments. The 'return' is the yearly profit. The higher the ROE, the more profit the company is making. So, as a general rule, a high ROE is a good thing. Clearly, then, one can use ROE to compare different companies.
Does Suncor Energy Have A Good ROE?
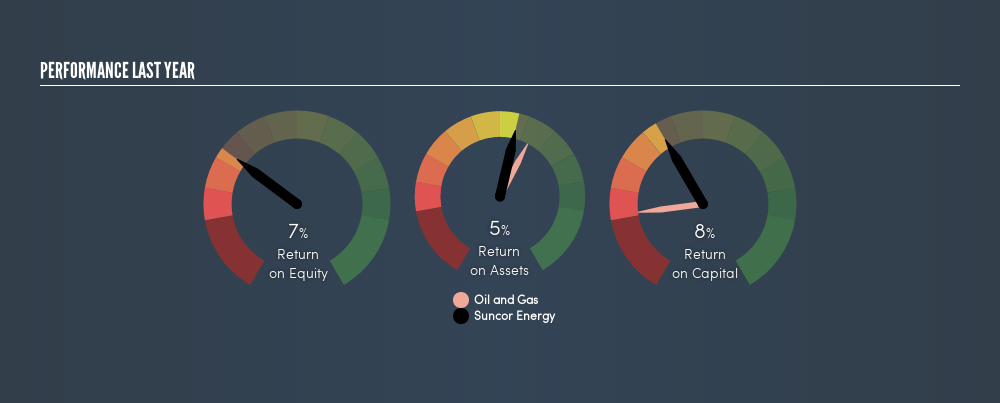
By comparing a company's ROE with its industry average, we can get a quick measure of how good it is. However, this method is only useful as a rough check, because companies do differ quite a bit within the same industry classification. The image below shows that Suncor Energy has an ROE that is roughly in line with the Oil and Gas industry average (7.6%).
That's not overly surprising. ROE tells us about the quality of the business, but it does not give us much of an idea if the share price is cheap. If you are like me, then you will not want to miss this freelist of growing companies that insiders are buying.
Why You Should Consider Debt When Looking At ROE
Virtually all companies need money to invest in the business, to grow profits. That cash can come from retained earnings, issuing new shares (equity), or debt. In the first two cases, the ROE will capture this use of capital to grow. In the latter case, the debt used for growth will improve returns, but won't affect the total equity. That will make the ROE look better than if no debt was used.
Combining Suncor Energy's Debt And Its 7.5% Return On Equity
Although Suncor Energy does use debt, its debt to equity ratio of 0.39 is still low. Its ROE isn't particularly impressive, but the debt levels are quite modest, so the business probably has some real potential. Careful use of debt to boost returns is often very good for shareholders. However, it could reduce the company's ability to take advantage of future opportunities.
The Bottom Line On ROE
Return on equity is useful for comparing the quality of different businesses. Companies that can achieve high returns on equity without too much debt are generally of good quality. If two companies have around the same level of debt to equity, and one has a higher ROE, I'd generally prefer the one with higher ROE.
But ROE is just one piece of a bigger puzzle, since high quality businesses often trade on high multiples of earnings. Profit growth rates, versus the expectations reflected in the price of the stock, are a particularly important to consider. So you might want to check this FREE visualization of analyst forecasts for the company.
But note: Suncor Energy may not be the best stock to buy. So take a peek at this free list of interesting companies with high ROE and low debt.
We aim to bring you long-term focused research analysis driven by fundamental data. Note that our analysis may not factor in the latest price-sensitive company announcements or qualitative material.
If you spot an error that warrants correction, please contact the editor at editorial-team@simplywallst.com. This article by Simply Wall St is general in nature. It does not constitute a recommendation to buy or sell any stock, and does not take account of your objectives, or your financial situation. Simply Wall St has no position in the stocks mentioned. Thank you for reading.
About TSX:SU
Suncor Energy
Operates as an integrated energy company in Canada, the United States, and internationally.
Undervalued with excellent balance sheet and pays a dividend.
Similar Companies
Market Insights


Advertisement
Community Narratives
The Future of Drug Testing? Fingerprint Tech Shows Serious Promise
Fair Value US$2.98|40.3% undervalued
JO
Community Contributor
Suncorp’s Next Chapter: Insurance-Only and Ready to Grow
Fair Value AU$22.83|7.9% undervalued
RO
Community Contributor
Thyssenkrupp Nucera Will Achieve Double-Digit Profits by 2030 Boosted by Hydrogen Growth
Fair Value €14.40|31.3% undervalued
CH
Community Contributor
Tesla’s Nvidia Moment – The AI & Robotics Inflection Point
Fair Value US$359.72|12.3% undervalued
BL
Community Contributor