- Canada
- /
- Oil and Gas
- /
- TSX:SES
Secure Energy Services (TSE:SES) delivers shareholders fantastic 62% CAGR over 3 years, surging 3.8% in the last week alone


The most you can lose on any stock (assuming you don't use leverage) is 100% of your money. But in contrast you can make much more than 100% if the company does well. For instance the Secure Energy Services Inc. (TSE:SES) share price is 292% higher than it was three years ago. How nice for those who held the stock! On top of that, the share price is up 40% in about a quarter.
The past week has proven to be lucrative for Secure Energy Services investors, so let's see if fundamentals drove the company's three-year performance.
Check out our latest analysis for Secure Energy Services
While markets are a powerful pricing mechanism, share prices reflect investor sentiment, not just underlying business performance. One imperfect but simple way to consider how the market perception of a company has shifted is to compare the change in the earnings per share (EPS) with the share price movement.
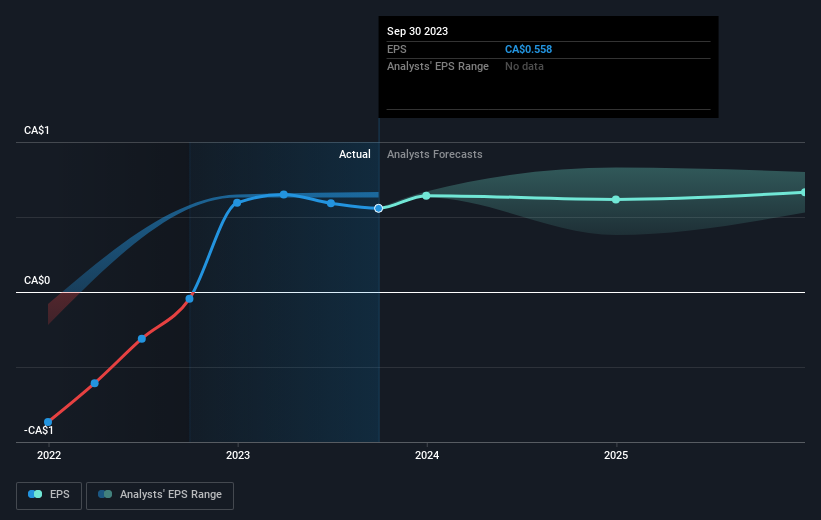
During three years of share price growth, Secure Energy Services moved from a loss to profitability. That kind of transition can be an inflection point that justifies a strong share price gain, just as we have seen here.
The graphic below depicts how EPS has changed over time (unveil the exact values by clicking on the image).
It's good to see that there was some significant insider buying in the last three months. That's a positive. That said, we think earnings and revenue growth trends are even more important factors to consider. This free interactive report on Secure Energy Services' earnings, revenue and cash flow is a great place to start, if you want to investigate the stock further.
What About Dividends?
When looking at investment returns, it is important to consider the difference between total shareholder return (TSR) and share price return. The TSR is a return calculation that accounts for the value of cash dividends (assuming that any dividend received was reinvested) and the calculated value of any discounted capital raisings and spin-offs. Arguably, the TSR gives a more comprehensive picture of the return generated by a stock. As it happens, Secure Energy Services' TSR for the last 3 years was 326%, which exceeds the share price return mentioned earlier. This is largely a result of its dividend payments!
A Different Perspective
It's good to see that Secure Energy Services has rewarded shareholders with a total shareholder return of 37% in the last twelve months. Of course, that includes the dividend. That's better than the annualised return of 10% over half a decade, implying that the company is doing better recently. Given the share price momentum remains strong, it might be worth taking a closer look at the stock, lest you miss an opportunity. While it is well worth considering the different impacts that market conditions can have on the share price, there are other factors that are even more important. Take risks, for example - Secure Energy Services has 2 warning signs (and 1 which is a bit concerning) we think you should know about.
If you like to buy stocks alongside management, then you might just love this free list of companies. (Hint: insiders have been buying them).
Please note, the market returns quoted in this article reflect the market weighted average returns of stocks that currently trade on Canadian exchanges.
New: Manage All Your Stock Portfolios in One Place
We've created the ultimate portfolio companion for stock investors, and it's free.
• Connect an unlimited number of Portfolios and see your total in one currency
• Be alerted to new Warning Signs or Risks via email or mobile
• Track the Fair Value of your stocks
Have feedback on this article? Concerned about the content? Get in touch with us directly. Alternatively, email editorial-team (at) simplywallst.com.
This article by Simply Wall St is general in nature. We provide commentary based on historical data and analyst forecasts only using an unbiased methodology and our articles are not intended to be financial advice. It does not constitute a recommendation to buy or sell any stock, and does not take account of your objectives, or your financial situation. We aim to bring you long-term focused analysis driven by fundamental data. Note that our analysis may not factor in the latest price-sensitive company announcements or qualitative material. Simply Wall St has no position in any stocks mentioned.
About TSX:SES
SECURE Waste Infrastructure
Engages in the waste management and energy infrastructure businesses primarily in Canada and the United States.
Very undervalued with solid track record and pays a dividend.
Similar Companies
Market Insights

Community Narratives


