
Advertisement
- Canada
- /
- Oil and Gas
- /
- TSX:PMT
Even With A 28% Surge, Cautious Investors Are Not Rewarding Perpetual Energy Inc.'s (TSE:PMT) Performance Completely
Perpetual Energy Inc. (TSE:PMT) shareholders would be excited to see that the share price has had a great month, posting a 28% gain and recovering from prior weakness. Unfortunately, the gains of the last month did little to right the losses of the last year with the stock still down 16% over that time.
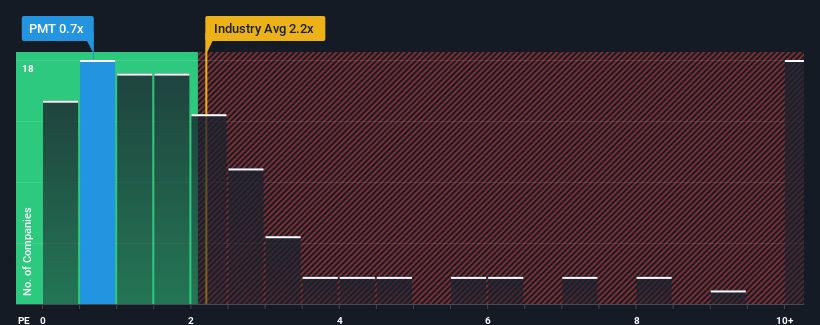
Although its price has surged higher, Perpetual Energy may still be sending bullish signals at the moment with its price-to-sales (or "P/S") ratio of 0.7x, since almost half of all companies in the Oil and Gas industry in Canada have P/S ratios greater than 2.2x and even P/S higher than 6x are not unusual. Although, it's not wise to just take the P/S at face value as there may be an explanation why it's limited.
View our latest analysis for Perpetual Energy
How Has Perpetual Energy Performed Recently?
As an illustration, revenue has deteriorated at Perpetual Energy over the last year, which is not ideal at all. One possibility is that the P/S is low because investors think the company won't do enough to avoid underperforming the broader industry in the near future. However, if this doesn't eventuate then existing shareholders may be feeling optimistic about the future direction of the share price.
Although there are no analyst estimates available for Perpetual Energy, take a look at this free data-rich visualisation to see how the company stacks up on earnings, revenue and cash flow.What Are Revenue Growth Metrics Telling Us About The Low P/S?
There's an inherent assumption that a company should underperform the industry for P/S ratios like Perpetual Energy's to be considered reasonable.
Taking a look back first, the company's revenue growth last year wasn't something to get excited about as it posted a disappointing decline of 40%. Still, the latest three year period has seen an excellent 126% overall rise in revenue, in spite of its unsatisfying short-term performance. Accordingly, while they would have preferred to keep the run going, shareholders would definitely welcome the medium-term rates of revenue growth.
Comparing that to the industry, which is only predicted to deliver 10% growth in the next 12 months, the company's momentum is stronger based on recent medium-term annualised revenue results.
With this information, we find it odd that Perpetual Energy is trading at a P/S lower than the industry. Apparently some shareholders believe the recent performance has exceeded its limits and have been accepting significantly lower selling prices.
The Key Takeaway
The latest share price surge wasn't enough to lift Perpetual Energy's P/S close to the industry median. Typically, we'd caution against reading too much into price-to-sales ratios when settling on investment decisions, though it can reveal plenty about what other market participants think about the company.
We're very surprised to see Perpetual Energy currently trading on a much lower than expected P/S since its recent three-year growth is higher than the wider industry forecast. When we see robust revenue growth that outpaces the industry, we presume that there are notable underlying risks to the company's future performance, which is exerting downward pressure on the P/S ratio. At least price risks look to be very low if recent medium-term revenue trends continue, but investors seem to think future revenue could see a lot of volatility.
It's always necessary to consider the ever-present spectre of investment risk. We've identified 5 warning signs with Perpetual Energy, and understanding these should be part of your investment process.
If these risks are making you reconsider your opinion on Perpetual Energy, explore our interactive list of high quality stocks to get an idea of what else is out there.
New: Manage All Your Stock Portfolios in One Place
We've created the ultimate portfolio companion for stock investors, and it's free.
• Connect an unlimited number of Portfolios and see your total in one currency
• Be alerted to new Warning Signs or Risks via email or mobile
• Track the Fair Value of your stocks
Have feedback on this article? Concerned about the content? Get in touch with us directly. Alternatively, email editorial-team (at) simplywallst.com.
This article by Simply Wall St is general in nature. We provide commentary based on historical data and analyst forecasts only using an unbiased methodology and our articles are not intended to be financial advice. It does not constitute a recommendation to buy or sell any stock, and does not take account of your objectives, or your financial situation. We aim to bring you long-term focused analysis driven by fundamental data. Note that our analysis may not factor in the latest price-sensitive company announcements or qualitative material. Simply Wall St has no position in any stocks mentioned.
About TSX:PMT
Perpetual Energy
Engages in the exploration, production, and marketing of oil and natural gas in Canada.
Mediocre balance sheet and slightly overvalued.
Market Insights

Advertisement
Community Narratives
MicroVision will explode future revenue by 380.37% with a vision towards success
Fair Value US$60|98.4% undervalued
TH
Community Contributor
The Indispensable Artery for a New North American Economy
Fair Value CA$132.87|0.8% undervalued
TI
Community Contributor
Recently Updated Narratives
RE

RecMag on Proximus ·
Proximus: The State-Backed Backup Plan with 7% Gross Yield and 15% Currency Upside.
Fair Value:€17.1359.3% undervalued
29 followersusers have followed this narrative
0 commentsusers have commented on this narrative
0 likesusers have liked this narrative
SW

swift11 on DXC Technology ·
CEO: We are winners in the long term in the AI world
Fair Value:US$17.4624.9% undervalued
1 followerusers have followed this narrative
0 commentsusers have commented on this narrative
0 likesusers have liked this narrative
AL

AlexLovell on Rocket Lab ·
Early mover in a fast growing industry. Likely to experience share price volatility as they scale
Fair Value:US$16.25158.0% overvalued
2 followersusers have followed this narrative
0 commentsusers have commented on this narrative
0 likesusers have liked this narrative
Popular Narratives
TH

TheWallstreetKing on MicroVision ·
MicroVision will explode future revenue by 380.37% with a vision towards success
Fair Value:US$6098.4% undervalued
97 followersusers have followed this narrative
10 commentsusers have commented on this narrative
19 likesusers have liked this narrative
OS


oscargarcia on Alphabet ·
The company that turned a verb into a global necessity and basically runs the modern internet, digital ads, smartphones, maps, and AI.
Fair Value:US$3405.9% undervalued
137 followersusers have followed this narrative
6 commentsusers have commented on this narrative
18 likesusers have liked this narrative
AN


AnalystConsensusTarget on NVIDIA ·
NVDA: Expanding AI Demand Will Drive Major Data Center Investments Through 2026
Fair Value:US$232.7922.6% undervalued
929 followersusers have followed this narrative
6 commentsusers have commented on this narrative
22 likesusers have liked this narrative