
Advertisement
- Canada
- /
- Oil and Gas
- /
- TSX:PEY
Did You Manage To Avoid Peyto Exploration & Development's (TSE:PEY) Devastating 85% Share Price Drop?

Long term investing works well, but it doesn't always work for each individual stock. It hits us in the gut when we see fellow investors suffer a loss. Anyone who held Peyto Exploration & Development Corp. (TSE:PEY) for five years would be nursing their metaphorical wounds since the share price dropped 85% in that time. And it's not just long term holders hurting, because the stock is down 50% in the last year. The falls have accelerated recently, with the share price down 25% in the last three months. This could be related to the recent financial results - you can catch up on the most recent data by reading our company report.
While a drop like that is definitely a body blow, money isn't as important as health and happiness.
Want to participate in a short research study? Help shape the future of investing tools and you could win a $250 gift card!
See our latest analysis for Peyto Exploration & Development
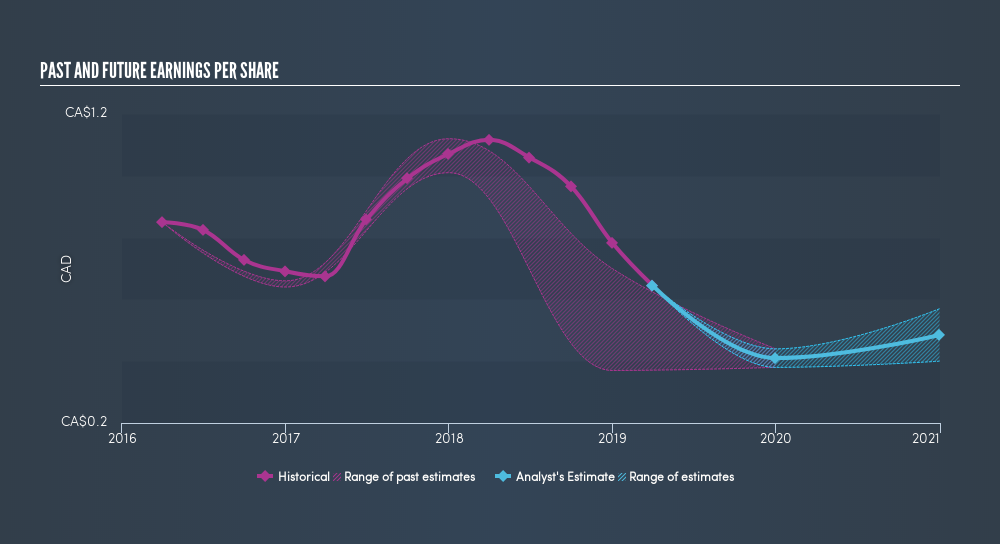
In his essay The Superinvestors of Graham-and-Doddsville Warren Buffett described how share prices do not always rationally reflect the value of a business. By comparing earnings per share (EPS) and share price changes over time, we can get a feel for how investor attitudes to a company have morphed over time.
During the five years over which the share price declined, Peyto Exploration & Development's earnings per share (EPS) dropped by 11% each year. This reduction in EPS is less than the 32% annual reduction in the share price. This implies that the market was previously too optimistic about the stock. The less favorable sentiment is reflected in its current P/E ratio of 8.76.
The company's earnings per share (over time) is depicted in the image below (click to see the exact numbers).
We consider it positive that insiders have made significant purchases in the last year. Even so, future earnings will be far more important to whether current shareholders make money. This free interactive report on Peyto Exploration & Development's earnings, revenue and cash flow is a great place to start, if you want to investigate the stock further.
What About Dividends?
As well as measuring the share price return, investors should also consider the total shareholder return (TSR). The TSR is a return calculation that accounts for the value of cash dividends (assuming that any dividend received was reinvested) and the calculated value of any discounted capital raisings and spin-offs. It's fair to say that the TSR gives a more complete picture for stocks that pay a dividend. As it happens, Peyto Exploration & Development's TSR for the last 5 years was -81%, which exceeds the share price return mentioned earlier. And there's no prize for guessing that the dividend payments largely explain the divergence!
A Different Perspective
While the broader market gained around 1.7% in the last year, Peyto Exploration & Development shareholders lost 47% (even including dividends). However, keep in mind that even the best stocks will sometimes underperform the market over a twelve month period. Unfortunately, last year's performance may indicate unresolved challenges, given that it was worse than the annualised loss of 28% over the last half decade. Generally speaking long term share price weakness can be a bad sign, though contrarian investors might want to research the stock in hope of a turnaround. Investors who like to make money usually check up on insider purchases, such as the price paid, and total amount bought. You can find out about the insider purchases of Peyto Exploration & Development by clicking this link.
Peyto Exploration & Development is not the only stock insiders are buying. So take a peek at this free list of growing companies with insider buying.
Please note, the market returns quoted in this article reflect the market weighted average returns of stocks that currently trade on CA exchanges.
We aim to bring you long-term focused research analysis driven by fundamental data. Note that our analysis may not factor in the latest price-sensitive company announcements or qualitative material.
If you spot an error that warrants correction, please contact the editor at editorial-team@simplywallst.com. This article by Simply Wall St is general in nature. It does not constitute a recommendation to buy or sell any stock, and does not take account of your objectives, or your financial situation. Simply Wall St has no position in the stocks mentioned. Thank you for reading.
About TSX:PEY
Peyto Exploration & Development
Engages in the exploration, development, and production of natural gas, oil, and natural gas liquids in Alberta’s deep basin.
Good value average dividend payer.
Market Insights


Advertisement
Community Narratives
Suncorp’s Next Chapter: Insurance-Only and Ready to Grow
Fair Value AU$22.83|5.7% undervalued
RO
Community Contributor
Thyssenkrupp Nucera Will Achieve Double-Digit Profits by 2030 Boosted by Hydrogen Growth
Fair Value €14.40|31.6% undervalued
CH
Community Contributor
Tesla’s Nvidia Moment – The AI & Robotics Inflection Point
Fair Value US$384.84|18.0% undervalued
BL
Community Contributor