
Advertisement

Want to participate in a short research study? Help shape the future of investing tools and you could win a $250 gift card!
The external fund manager backed by Berkshire Hathaway's Charlie Munger, Li Lu, makes no bones about it when he says 'The biggest investment risk is not the volatility of prices, but whether you will suffer a permanent loss of capital.' When we think about how risky a company is, we always like to look at its use of debt, since debt overload can lead to ruin. As with many other companies. Journey Energy Inc. (TSE:JOY) makes use of debt. But the more important question is: how much risk is that debt creating?
Why Does Debt Bring Risk?
Debt is a tool to help businesses grow, but if a business is incapable of paying off its lenders, then it exists at their mercy. If things get really bad, the lenders can take control of the business. However, a more frequent (but still costly) occurrence is where a company must issue shares at bargain-basement prices, permanently diluting shareholders, just to shore up its balance sheet. By replacing dilution, though, debt can be an extremely good tool for businesses that need capital to invest in growth at high rates of return. When we think about a company's use of debt, we first look at cash and debt together.
See our latest analysis for Journey Energy
What Is Journey Energy's Debt?
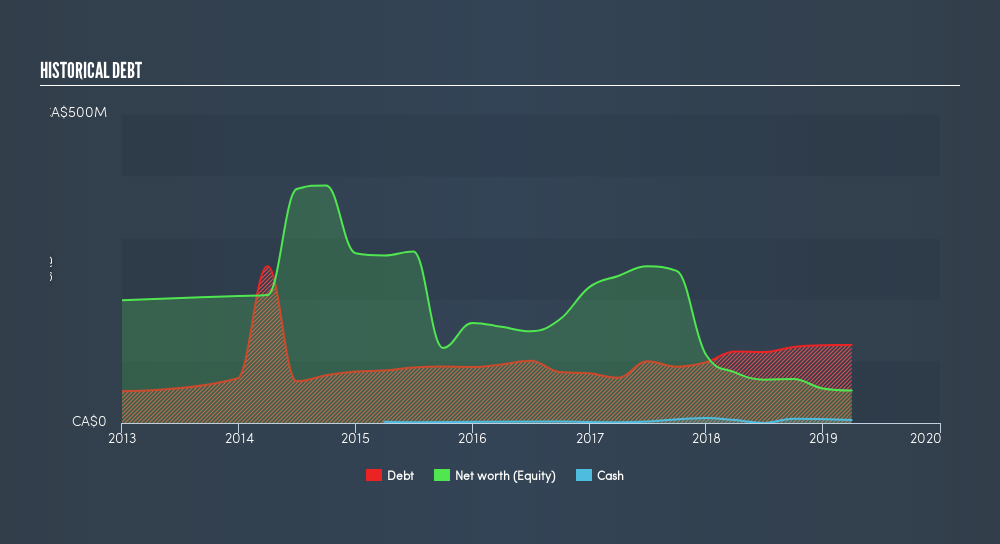
The image below, which you can click on for greater detail, shows that at March 2019 Journey Energy had debt of CA$126.1m, up from CA$115.8m in one year. On the flip side, it has CA$4.79m in cash leading to net debt of about CA$121.4m.
How Healthy Is Journey Energy's Balance Sheet?
Zooming in on the latest balance sheet data, we can see that Journey Energy had liabilities of CA$26.2m due within 12 months and liabilities of CA$331.3m due beyond that. Offsetting this, it had CA$4.79m in cash and CA$15.3m in receivables that were due within 12 months. So its liabilities outweigh the sum of its cash and (near-term) receivables by CA$337.4m.
The deficiency here weighs heavily on the CA$97.8m company itself, as if a child were struggling under the weight of an enormous back-pack full of books, his sports gear, and a trumpet. So we'd watch its balance sheet closely, without a doubt At the end of the day, Journey Energy would probably need a major re-capitalization if its creditors were to demand repayment. Either way, since Journey Energy does have more debt than cash, it's worth keeping an eye on its balance sheet. The balance sheet is clearly the area to focus on when you are analysing debt. But ultimately the future profitability of the business will decide if Journey Energy can strengthen its balance sheet over time. So if you're focused on the future you can check out this free report showing analyst profit forecasts.
In the last year Journey Energy managed to grow its revenue by 2.4%, to CA$103m. We usually like to see faster growth from unprofitable companies, but each to their own.
Caveat Emptor
Over the last twelve months Journey Energy produced an earnings before interest and tax (EBIT) loss. Indeed, it lost CA$5.6m at the EBIT level. If you consider the significant liabilities mentioned above, we are extremely wary of this investment. That said, it is possible that the company will turn its fortunes around. But we think that is unlikely, given it is low on liquid assets, and burned through CA$6.3m in the last year. So we think this stock is risky, like walking through a dirty dog park with a mask on. When we look at a riskier company, we like to check how their profits (or losses) are trending over time. Today, we're providing readers this interactive graph showing how Journey Energy's profit, revenue, and operating cashflow have changed over the last few years.
If you're interested in investing in businesses that can grow profits without the burden of debt, then check out this free list of growing businesses that have net cash on the balance sheet.
We aim to bring you long-term focused research analysis driven by fundamental data. Note that our analysis may not factor in the latest price-sensitive company announcements or qualitative material.
If you spot an error that warrants correction, please contact the editor at editorial-team@simplywallst.com. This article by Simply Wall St is general in nature. It does not constitute a recommendation to buy or sell any stock, and does not take account of your objectives, or your financial situation. Simply Wall St has no position in the stocks mentioned. Thank you for reading.
About TSX:JOY
Journey Energy
Engages in the exploration, development, and production of crude oil and natural gas in the province of Alberta, Canada.
Good value with reasonable growth potential.
Market Insights


Advertisement
Community Narratives
The Future of Drug Testing? Fingerprint Tech Shows Serious Promise
Fair Value US$2.98|40.3% undervalued
JO
Community Contributor
Suncorp’s Next Chapter: Insurance-Only and Ready to Grow
Fair Value AU$22.83|7.9% undervalued
RO
Community Contributor
Thyssenkrupp Nucera Will Achieve Double-Digit Profits by 2030 Boosted by Hydrogen Growth
Fair Value €14.40|31.6% undervalued
CH
Community Contributor
Tesla’s Nvidia Moment – The AI & Robotics Inflection Point
Fair Value US$359.72|12.3% undervalued
BL
Community Contributor