
Advertisement
- Canada
- /
- Oil and Gas
- /
- TSX:IPCO
Why You Should Like International Petroleum Corporation’s (TSE:IPCO) ROCE

Today we'll look at International Petroleum Corporation (TSE:IPCO) and reflect on its potential as an investment. In particular, we'll consider its Return On Capital Employed (ROCE), as that can give us insight into how profitably the company is able to employ capital in its business.
Firstly, we'll go over how we calculate ROCE. Then we'll compare its ROCE to similar companies. Finally, we'll look at how its current liabilities affect its ROCE.
What is Return On Capital Employed (ROCE)?
ROCE measures the amount of pre-tax profits a company can generate from the capital employed in its business. In general, businesses with a higher ROCE are usually better quality. Ultimately, it is a useful but imperfect metric. Author Edwin Whiting says to be careful when comparing the ROCE of different businesses, since 'No two businesses are exactly alike.'
How Do You Calculate Return On Capital Employed?
The formula for calculating the return on capital employed is:
Return on Capital Employed = Earnings Before Interest and Tax (EBIT) ÷ (Total Assets - Current Liabilities)
Or for International Petroleum:
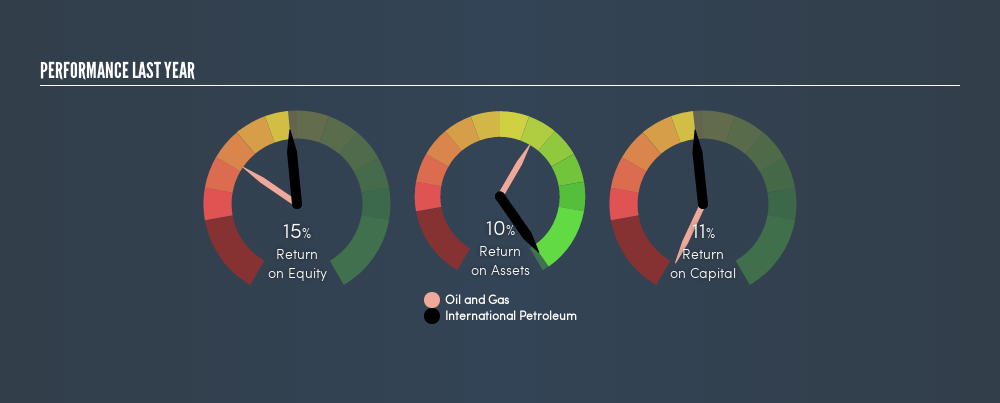
0.11 = US$136m ÷ (US$1.3b - US$97m) (Based on the trailing twelve months to March 2019.)
Therefore, International Petroleum has an ROCE of 11%.
View our latest analysis for International Petroleum
Does International Petroleum Have A Good ROCE?
ROCE is commonly used for comparing the performance of similar businesses. In our analysis, International Petroleum's ROCE is meaningfully higher than the 6.4% average in the Oil and Gas industry. We consider this a positive sign, because it suggests it uses capital more efficiently than similar companies. Separate from International Petroleum's performance relative to its industry, its ROCE in absolute terms looks satisfactory, and it may be worth researching in more depth.
International Petroleum delivered an ROCE of 11%, which is better than 3 years ago, as was making losses back then. That implies the business has been improving.
Remember that this metric is backwards looking - it shows what has happened in the past, and does not accurately predict the future. ROCE can be misleading for companies in cyclical industries, with returns looking impressive during the boom times, but very weak during the busts. This is because ROCE only looks at one year, instead of considering returns across a whole cycle. Remember that most companies like International Petroleum are cyclical businesses. Future performance is what matters, and you can see analyst predictions in our free report on analyst forecasts for the company.
How International Petroleum's Current Liabilities Impact Its ROCE
Short term (or current) liabilities, are things like supplier invoices, overdrafts, or tax bills that need to be paid within 12 months. Due to the way ROCE is calculated, a high level of current liabilities makes a company look as though it has less capital employed, and thus can (sometimes unfairly) boost the ROCE. To counter this, investors can check if a company has high current liabilities relative to total assets.
International Petroleum has total liabilities of US$97m and total assets of US$1.3b. Therefore its current liabilities are equivalent to approximately 7.5% of its total assets. With low current liabilities, International Petroleum's decent ROCE looks that much more respectable.
What We Can Learn From International Petroleum's ROCE
If International Petroleum can continue reinvesting in its business, it could be an attractive prospect. There might be better investments than International Petroleum out there, but you will have to work hard to find them . These promising businesses with rapidly growing earnings might be right up your alley.
If you like to buy stocks alongside management, then you might just love this free list of companies. (Hint: insiders have been buying them).
We aim to bring you long-term focused research analysis driven by fundamental data. Note that our analysis may not factor in the latest price-sensitive company announcements or qualitative material.
If you spot an error that warrants correction, please contact the editor at editorial-team@simplywallst.com. This article by Simply Wall St is general in nature. It does not constitute a recommendation to buy or sell any stock, and does not take account of your objectives, or your financial situation. Simply Wall St has no position in the stocks mentioned. Thank you for reading.
About TSX:IPCO
International Petroleum
Explores for, develops, and produces oil and gas.
High growth potential with adequate balance sheet.
Similar Companies
Market Insights


Advertisement
Community Narratives
The Future of Drug Testing? Fingerprint Tech Shows Serious Promise
Fair Value US$2.98|43.0% undervalued
JO
Community Contributor
Suncorp’s Next Chapter: Insurance-Only and Ready to Grow
Fair Value AU$22.83|7.6% undervalued
RO
Community Contributor
Thyssenkrupp Nucera Will Achieve Double-Digit Profits by 2030 Boosted by Hydrogen Growth
Fair Value €14.40|30.6% undervalued
CH
Community Contributor
Tesla’s Nvidia Moment – The AI & Robotics Inflection Point
Fair Value US$359.72|18.3% undervalued
BL
Community Contributor