Stock Analysis
- Canada
- /
- Oil and Gas
- /
- TSX:IMO
Despite shrinking by CA$3.0b in the past week, Imperial Oil (TSE:IMO) shareholders are still up 224% over 3 years


The most you can lose on any stock (assuming you don't use leverage) is 100% of your money. But when you pick a company that is really flourishing, you can make more than 100%. To wit, the Imperial Oil Limited (TSE:IMO) share price has flown 200% in the last three years. Most would be happy with that. It's also good to see the share price up 27% over the last quarter.
Since the long term performance has been good but there's been a recent pullback of 5.5%, let's check if the fundamentals match the share price.
View our latest analysis for Imperial Oil
There is no denying that markets are sometimes efficient, but prices do not always reflect underlying business performance. By comparing earnings per share (EPS) and share price changes over time, we can get a feel for how investor attitudes to a company have morphed over time.
During three years of share price growth, Imperial Oil moved from a loss to profitability. That kind of transition can be an inflection point that justifies a strong share price gain, just as we have seen here.
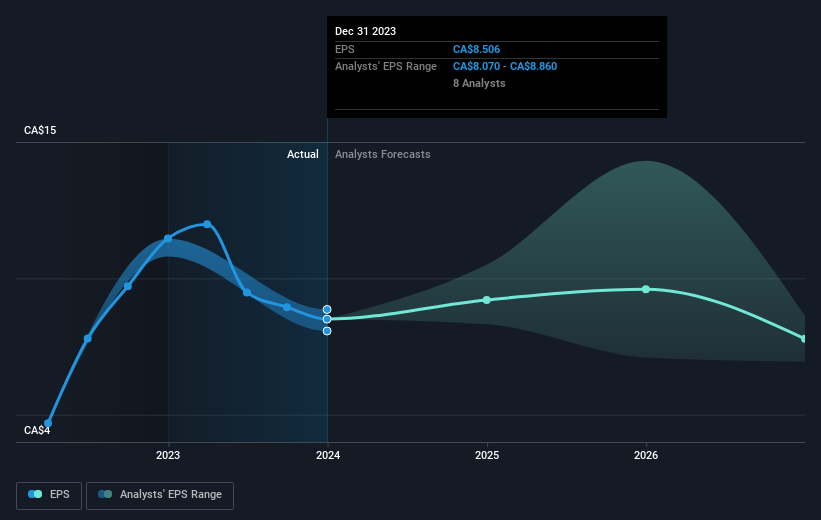
The company's earnings per share (over time) is depicted in the image below (click to see the exact numbers).
We know that Imperial Oil has improved its bottom line over the last three years, but what does the future have in store? Take a more thorough look at Imperial Oil's financial health with this free report on its balance sheet.
What About Dividends?
As well as measuring the share price return, investors should also consider the total shareholder return (TSR). Whereas the share price return only reflects the change in the share price, the TSR includes the value of dividends (assuming they were reinvested) and the benefit of any discounted capital raising or spin-off. Arguably, the TSR gives a more comprehensive picture of the return generated by a stock. We note that for Imperial Oil the TSR over the last 3 years was 224%, which is better than the share price return mentioned above. This is largely a result of its dividend payments!
A Different Perspective
It's nice to see that Imperial Oil shareholders have received a total shareholder return of 35% over the last year. That's including the dividend. Since the one-year TSR is better than the five-year TSR (the latter coming in at 23% per year), it would seem that the stock's performance has improved in recent times. Given the share price momentum remains strong, it might be worth taking a closer look at the stock, lest you miss an opportunity. It's always interesting to track share price performance over the longer term. But to understand Imperial Oil better, we need to consider many other factors. For example, we've discovered 1 warning sign for Imperial Oil that you should be aware of before investing here.
If you like to buy stocks alongside management, then you might just love this free list of companies. (Hint: insiders have been buying them).
Please note, the market returns quoted in this article reflect the market weighted average returns of stocks that currently trade on Canadian exchanges.
Valuation is complex, but we're helping make it simple.
Find out whether Imperial Oil is potentially over or undervalued by checking out our comprehensive analysis, which includes fair value estimates, risks and warnings, dividends, insider transactions and financial health.
View the Free AnalysisHave feedback on this article? Concerned about the content? Get in touch with us directly. Alternatively, email editorial-team (at) simplywallst.com.
This article by Simply Wall St is general in nature. We provide commentary based on historical data and analyst forecasts only using an unbiased methodology and our articles are not intended to be financial advice. It does not constitute a recommendation to buy or sell any stock, and does not take account of your objectives, or your financial situation. We aim to bring you long-term focused analysis driven by fundamental data. Note that our analysis may not factor in the latest price-sensitive company announcements or qualitative material. Simply Wall St has no position in any stocks mentioned.
About TSX:IMO
Imperial Oil
Imperial Oil Limited engages in exploration, production, and sale of crude oil and natural gas in Canada.
Excellent balance sheet established dividend payer.
