
Advertisement

Want to participate in a short research study? Help shape the future of investing tools and you could win a $250 gift card!
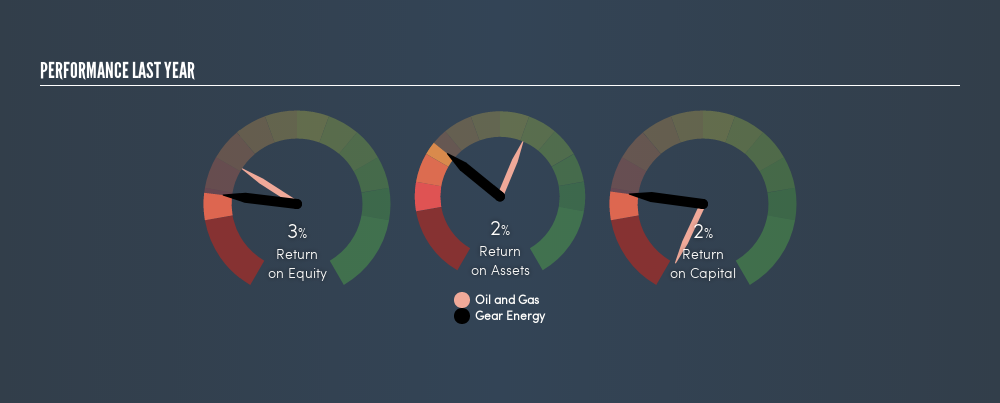
Today we are going to look at Gear Energy Ltd. (TSE:GXE) to see whether it might be an attractive investment prospect. To be precise, we'll consider its Return On Capital Employed (ROCE), as that will inform our view of the quality of the business.
First, we'll go over how we calculate ROCE. Next, we'll compare it to others in its industry. Then we'll determine how its current liabilities are affecting its ROCE.
Understanding Return On Capital Employed (ROCE)
ROCE measures the amount of pre-tax profits a company can generate from the capital employed in its business. All else being equal, a better business will have a higher ROCE. Ultimately, it is a useful but imperfect metric. Renowned investment researcher Michael Mauboussin has suggested that a high ROCE can indicate that 'one dollar invested in the company generates value of more than one dollar'.
So, How Do We Calculate ROCE?
The formula for calculating the return on capital employed is:
Return on Capital Employed = Earnings Before Interest and Tax (EBIT) ÷ (Total Assets - Current Liabilities)
Or for Gear Energy:
0.021 = CA$7.8m ÷ (CA$380m - CA$14m) (Based on the trailing twelve months to December 2018.)
So, Gear Energy has an ROCE of 2.1%.
View our latest analysis for Gear Energy
Does Gear Energy Have A Good ROCE?
When making comparisons between similar businesses, investors may find ROCE useful. In this analysis, Gear Energy's ROCE appears meaningfully below the 6.0% average reported by the Oil and Gas industry. This performance is not ideal, as it suggests the company may not be deploying its capital as effectively as some competitors. Regardless of how Gear Energy stacks up against its industry, its ROCE in absolute terms is quite low (especially compared to a bank account). It is likely that there are more attractive prospects out there.
Gear Energy reported an ROCE of 2.1% -- better than 3 years ago, when the company didn't make a profit. This makes us wonder if the company is improving.
When considering ROCE, bear in mind that it reflects the past and does not necessarily predict the future. ROCE can be misleading for companies in cyclical industries, with returns looking impressive during the boom times, but very weak during the busts. This is because ROCE only looks at one year, instead of considering returns across a whole cycle. Given the industry it operates in, Gear Energy could be considered cyclical. Future performance is what matters, and you can see analyst predictions in our free report on analyst forecasts for the company.
How Gear Energy's Current Liabilities Impact Its ROCE
Liabilities, such as supplier bills and bank overdrafts, are referred to as current liabilities if they need to be paid within 12 months. The ROCE equation subtracts current liabilities from capital employed, so a company with a lot of current liabilities appears to have less capital employed, and a higher ROCE than otherwise. To counteract this, we check if a company has high current liabilities, relative to its total assets.
Gear Energy has total liabilities of CA$14m and total assets of CA$380m. As a result, its current liabilities are equal to approximately 3.8% of its total assets. With barely any current liabilities, there is minimal impact on Gear Energy's admittedly low ROCE.
Our Take On Gear Energy's ROCE
Still, investors could probably find more attractive prospects with better performance out there. Of course, you might also be able to find a better stock than Gear Energy. So you may wish to see this free collection of other companies that have grown earnings strongly.
I will like Gear Energy better if I see some big insider buys. While we wait, check out this free list of growing companies with considerable, recent, insider buying.
We aim to bring you long-term focused research analysis driven by fundamental data. Note that our analysis may not factor in the latest price-sensitive company announcements or qualitative material.
If you spot an error that warrants correction, please contact the editor at editorial-team@simplywallst.com. This article by Simply Wall St is general in nature. It does not constitute a recommendation to buy or sell any stock, and does not take account of your objectives, or your financial situation. Simply Wall St has no position in the stocks mentioned. Thank you for reading.
About TSX:GXE
Gear Energy
An exploration and production company, engages in the acquiring, developing, and holding of interests in petroleum and natural gas properties and assets in Canada.
Excellent balance sheet second-rate dividend payer.
Market Insights


Advertisement
Community Narratives
The Future of Drug Testing? Fingerprint Tech Shows Serious Promise
Fair Value US$2.98|40.3% undervalued
JO
Community Contributor
Suncorp’s Next Chapter: Insurance-Only and Ready to Grow
Fair Value AU$22.83|7.6% undervalued
RO
Community Contributor
Thyssenkrupp Nucera Will Achieve Double-Digit Profits by 2030 Boosted by Hydrogen Growth
Fair Value €14.40|31.6% undervalued
CH
Community Contributor
Tesla’s Nvidia Moment – The AI & Robotics Inflection Point
Fair Value US$359.72|12.3% undervalued
BL
Community Contributor