- Canada
- /
- Oil and Gas
- /
- TSX:GEI
Shareholders Of Gibson Energy (TSE:GEI) Must Be Happy With Their 88% Return


If you buy and hold a stock for many years, you'd hope to be making a profit. Better yet, you'd like to see the share price move up more than the market average. Unfortunately for shareholders, while the Gibson Energy Inc. (TSE:GEI) share price is up 32% in the last five years, that's less than the market return. But if you include dividends then the return is market-beating. Unfortunately the share price is down 24% in the last year.
Check out our latest analysis for Gibson Energy
There is no denying that markets are sometimes efficient, but prices do not always reflect underlying business performance. One flawed but reasonable way to assess how sentiment around a company has changed is to compare the earnings per share (EPS) with the share price.
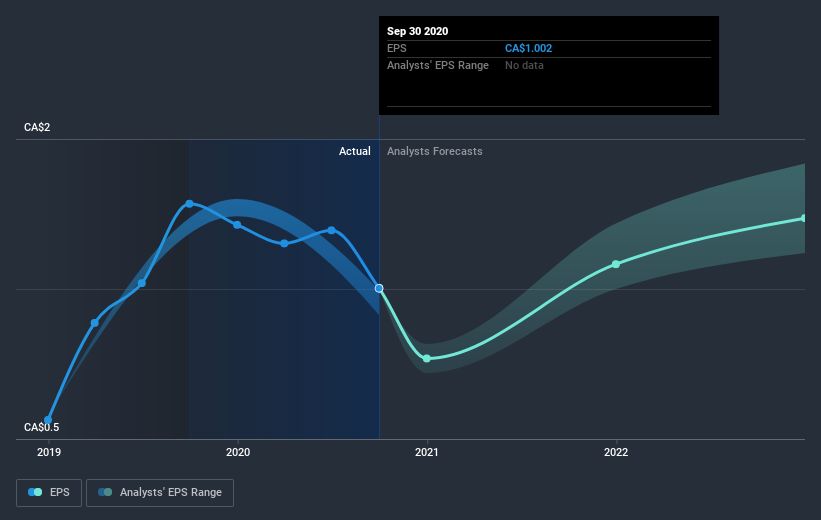
During the five years of share price growth, Gibson Energy moved from a loss to profitability. That would generally be considered a positive, so we'd expect the share price to be up.
The graphic below depicts how EPS has changed over time (unveil the exact values by clicking on the image).
It's good to see that there was some significant insider buying in the last three months. That's a positive. On the other hand, we think the revenue and earnings trends are much more meaningful measures of the business. Before buying or selling a stock, we always recommend a close examination of historic growth trends, available here..
What About Dividends?
It is important to consider the total shareholder return, as well as the share price return, for any given stock. The TSR is a return calculation that accounts for the value of cash dividends (assuming that any dividend received was reinvested) and the calculated value of any discounted capital raisings and spin-offs. It's fair to say that the TSR gives a more complete picture for stocks that pay a dividend. As it happens, Gibson Energy's TSR for the last 5 years was 88%, which exceeds the share price return mentioned earlier. This is largely a result of its dividend payments!
A Different Perspective
Gibson Energy shareholders are down 19% for the year (even including dividends), but the market itself is up 5.5%. However, keep in mind that even the best stocks will sometimes underperform the market over a twelve month period. Longer term investors wouldn't be so upset, since they would have made 13%, each year, over five years. It could be that the recent sell-off is an opportunity, so it may be worth checking the fundamental data for signs of a long term growth trend. I find it very interesting to look at share price over the long term as a proxy for business performance. But to truly gain insight, we need to consider other information, too. Take risks, for example - Gibson Energy has 2 warning signs (and 1 which shouldn't be ignored) we think you should know about.
There are plenty of other companies that have insiders buying up shares. You probably do not want to miss this free list of growing companies that insiders are buying.
Please note, the market returns quoted in this article reflect the market weighted average returns of stocks that currently trade on CA exchanges.
If you decide to trade Gibson Energy, use the lowest-cost* platform that is rated #1 Overall by Barron’s, Interactive Brokers. Trade stocks, options, futures, forex, bonds and funds on 135 markets, all from a single integrated account. Promoted
If you're looking to trade Gibson Energy, open an account with the lowest-cost platform trusted by professionals, Interactive Brokers.
With clients in over 200 countries and territories, and access to 160 markets, IBKR lets you trade stocks, options, futures, forex, bonds and funds from a single integrated account.
Enjoy no hidden fees, no account minimums, and FX conversion rates as low as 0.03%, far better than what most brokers offer.
Sponsored ContentNew: Manage All Your Stock Portfolios in One Place
We've created the ultimate portfolio companion for stock investors, and it's free.
• Connect an unlimited number of Portfolios and see your total in one currency
• Be alerted to new Warning Signs or Risks via email or mobile
• Track the Fair Value of your stocks
This article by Simply Wall St is general in nature. It does not constitute a recommendation to buy or sell any stock, and does not take account of your objectives, or your financial situation. We aim to bring you long-term focused analysis driven by fundamental data. Note that our analysis may not factor in the latest price-sensitive company announcements or qualitative material. Simply Wall St has no position in any stocks mentioned.
*Interactive Brokers Rated Lowest Cost Broker by StockBrokers.com Annual Online Review 2020
Have feedback on this article? Concerned about the content? Get in touch with us directly. Alternatively, email editorial-team (at) simplywallst.com.
About TSX:GEI
Gibson Energy
Engages in the gathering, storing, optimizing, and processing of liquids and refined products in Canada and the United States.
Established dividend payer with moderate growth potential.
Similar Companies
Market Insights

Community Narratives

