
Advertisement

Want to participate in a short research study? Help shape the future of investing tools and you could win a $250 gift card!
Is Enbridge Inc. (TSE:ENB) a good dividend stock? How would you know? A dividend paying company with growing earnings can be rewarding in the long term. On the other hand, investors have been known to buy a stock because of its yield, and then lose money if the company's dividend doesn't live up to expectations.
In this case, Enbridge likely looks attractive to investors, given its 6.0% dividend yield and a payment history of over ten years. It's likely that plenty of investors have purchased it for the income. When buying stocks for their dividends, you should always run through the checks below, to see if the dividend looks sustainable.
Explore this interactive chart for our latest analysis on Enbridge!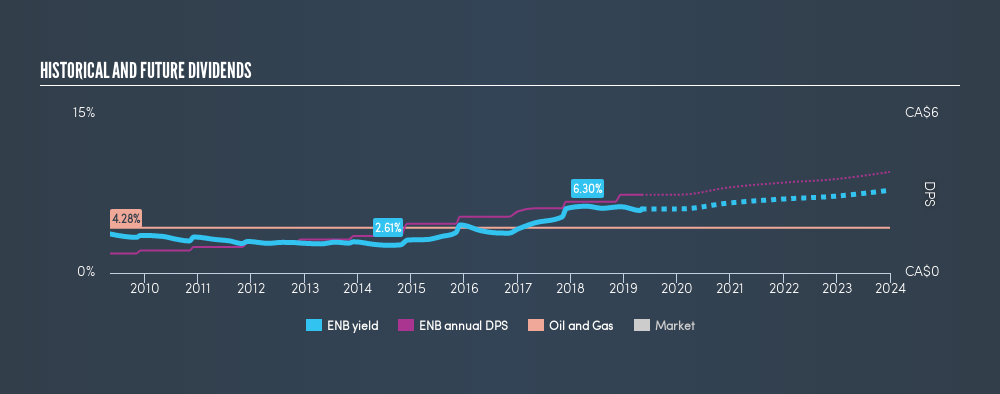
Payout ratios
Dividends are usually paid out of company earnings. If a company is paying more than it earns, then the dividend might become unsustainable - hardly an ideal situation. Comparing dividend payments to a company's net profit after tax is a simple way of reality-checking whether a dividend is sustainable. In the last year, Enbridge paid out 184% of its profit as dividends. A payout ratio above 100% is definitely an item of concern, unless there are some other circumstances that would justify it.
We also measure dividends paid against a company's levered free cash flow, to see if enough cash was generated to cover the dividend. Enbridge paid out 122% of its free cash last year. Cash flows can be lumpy, but paying out this much cash is not ideal.
Is Enbridge's Balance Sheet Risky?
As Enbridge's dividend was not well covered by earnings, we need to check its balance sheet for signs of financial distress. A rough way to check this is with these two simple ratios: a) net debt divided by EBITDA (earnings before interest, tax, depreciation and amortisation), and b) net interest cover. Net debt to EBITDA is a measure of a company's total debt. Net interest cover measures the ability to meet interest payments on debt. Essentially we check that a) a company does not have too much debt, and b) that it can afford to pay the interest. Enbridge has net debt of 6.34 times its earnings before interest, tax, depreciation and amortisation (EBITDA) which implies meaningful risk if interest rates rise of earnings decline.
We calculated its interest cover by measuring its earnings before interest and tax (EBIT), and dividing this by the company's net interest expense. With EBIT of 2.57 times its interest expense, Enbridge's interest cover is starting to look a bit thin. High debt and weak interest cover are not a great combo, and we would be cautious of relying on this company's dividend while these metrics persist.
Consider getting our latest analysis on Enbridge's financial position here.
Dividend Volatility
Before buying a stock for its income, we want to see if the dividends have been stable in the past, and if the company has a track record of maintaining its dividend. Enbridge has been paying dividends for a long time, but for the purpose of this analysis, we only examine the past 10 years of payments. The dividend has been stable over the past 10 years, which is great. We think this could suggest some resilience to the business and its dividends. During the past ten-year period, the first annual payment was CA$0.74 in 2009, compared to CA$2.95 last year. Dividends per share have grown at approximately 15% per year over this time.
Dividend Growth Potential
While dividend payments have been relatively reliable, it would also be nice if earnings per share (EPS) were growing, as this is essential to maintaining the dividend's purchasing power over the long term. It's good to see Enbridge has been growing its earnings per share at 22% a year over the past 5 years. Earnings per share have been growing very rapidly, although the company is also paying out virtually all of its profit in dividends. Generally, a company that is growing rapidly while paying out a majority of its earnings, is seeing its debt burden increase. We'd be conscious of any extra risk added by this practice.
Conclusion
When we look at a dividend stock, we need to form a judgement on whether the dividend will grow, if the company is able to maintain it in a wide range of economic circumstances, and if the dividend payout is sustainable. We're a bit uncomfortable with Enbridge paying out a high percentage of both its cashflow and earnings. Next, growing earnings per share and steady dividend payments is a great combination. Ultimately, Enbridge comes up short on our dividend analysis. It's not that we think it is a bad company - just that there are likely more appealing dividend prospects out there on this analysis.
Companies that are growing earnings tend to be the best dividend stocks over the long term. See what the 12 analysts we track are forecasting for Enbridge for free with public analyst estimates for the company.
We have also put together a list of global stocks with a market capitalisation above $1bn and yielding more 3%.
We aim to bring you long-term focused research analysis driven by fundamental data. Note that our analysis may not factor in the latest price-sensitive company announcements or qualitative material.
If you spot an error that warrants correction, please contact the editor at editorial-team@simplywallst.com. This article by Simply Wall St is general in nature. It does not constitute a recommendation to buy or sell any stock, and does not take account of your objectives, or your financial situation. Simply Wall St has no position in the stocks mentioned. Thank you for reading.
About TSX:ENB
Average dividend payer with acceptable track record.
Similar Companies
Market Insights


Advertisement
Community Narratives
For the Emperor: Why Games Workshop Could Be a Star Investment
Fair Value UK£160.00|0.4% overvalued
RO
Community Contributor
Securitas will boost margins with AI and tech-driven services
Fair Value SEK 260.91|44.5% undervalued
UN
Community Contributor
A Leader in EV Charging with Growth Potential
Fair Value €27.00|17.8% undervalued
TI
Community Contributor