Advertisement
- Canada
- /
- Oil and Gas
- /
- TSX:ENB
Assessing Enbridge’s Valuation After 33% Stock Surge and Rising Energy Demand in 2025

Simply Wall St
Reviewed by Bailey Pemberton
If you have been eyeing Enbridge stock lately, you are not alone. Plenty of investors are asking whether now is the right time to buy, hold, or cash out. With the latest close at $69.39 and a sharp 33.3% jump over the past year, Enbridge is making waves among both income seekers and those on the hunt for growth. Even on a shorter timeline, the stock has edged up 0.4% in the last week and 4.3% over the past month. This shows that momentum is more than just a passing phase.
Digging a little deeper, Enbridge's 12.2% return since the beginning of the year and a staggering 142.5% rally over five years tell a story of steady performance. Part of this renewed optimism comes as global energy markets rebalance and investors show increasing appetite for reliable infrastructure plays, especially with North American pipeline stability back in focus. This shift has given Enbridge renewed interest, with investors re-evaluating the company's risk profile and future earnings potential.
Of course, no decision about Enbridge would be complete without putting its valuation under the microscope. According to the widely used composite score approach, Enbridge gets a 2 out of 6 on the undervaluation scale. So what does this really mean for your next move with the stock? Here is a closer look at how valuation is assessed by different methods. In the end, the best perspective may go beyond any single checklist.
Enbridge scores just 2/6 on our valuation checks. See what other red flags we found in the full valuation breakdown.
Approach 1: Enbridge Discounted Cash Flow (DCF) Analysis
The Discounted Cash Flow (DCF) model estimates a company's intrinsic value by projecting its future cash flows and discounting them back to their value today. This approach aims to determine what the business is truly worth based on expected free cash flow generation.
For Enbridge, the latest reported Free Cash Flow (FCF) over the last twelve months stands at CA$5.35 billion. Analyst estimates cover FCF projections for the next five years, and beyond that, additional growth is extrapolated. By 2035, future free cash flow is forecast to reach roughly CA$23.5 billion. These projections highlight expectations of steady cash flow expansion as Enbridge benefits from stable infrastructure demand and the ongoing energy transition.
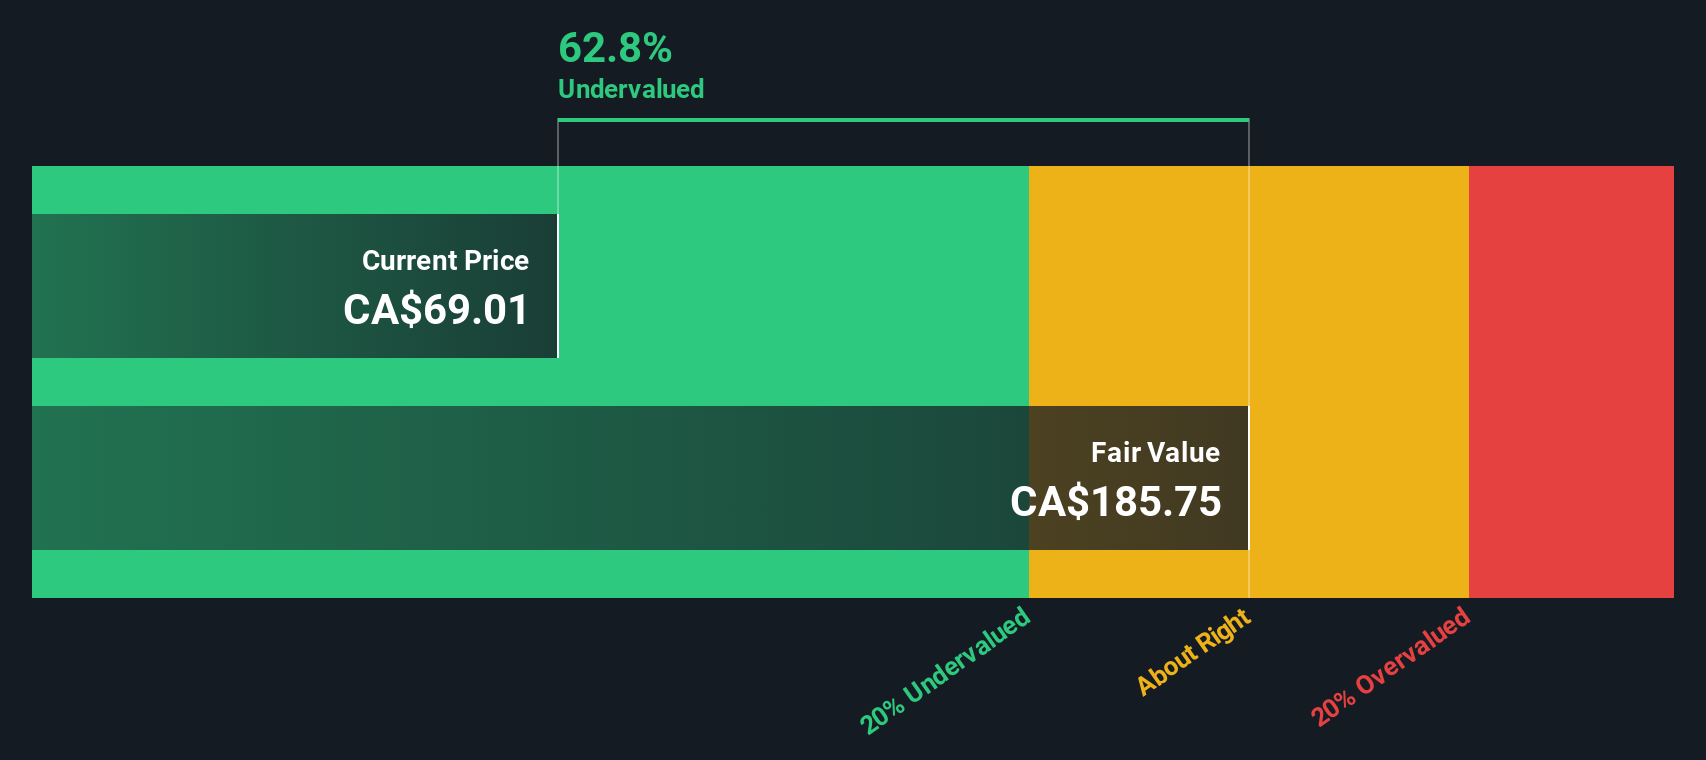
According to the 2 Stage Free Cash Flow to Equity DCF model, Enbridge's fair value is calculated at CA$185.70 per share. This figure is more than double its recent share price of CA$69.39, implying the stock is trading at a 62.6% discount to its estimated intrinsic value based on forward-looking cash generation.
This substantial gap between the calculated DCF value and the current market price suggests that Enbridge is significantly undervalued relative to its future cash flow potential.
Result: UNDERVALUED
Our Discounted Cash Flow (DCF) analysis suggests Enbridge is undervalued by 62.6%. Track this in your watchlist or portfolio, or discover more undervalued stocks.
Approach 2: Enbridge Price vs Earnings
The Price-to-Earnings (PE) ratio is a core valuation tool for profitable companies like Enbridge. It directly compares the company's share price to its per-share earnings. This metric is widely used by investors to weigh how much they are paying for each dollar of profit the company generates, making it especially relevant for established businesses with steady earnings.
Growth expectations and perceived business risk play a big role in shaping what is considered a "normal" or "fair" PE ratio. Faster-growing companies with solid track records and lower risk profiles typically command higher multiples. More mature, slower-growing, or riskier firms usually see lower PEs.
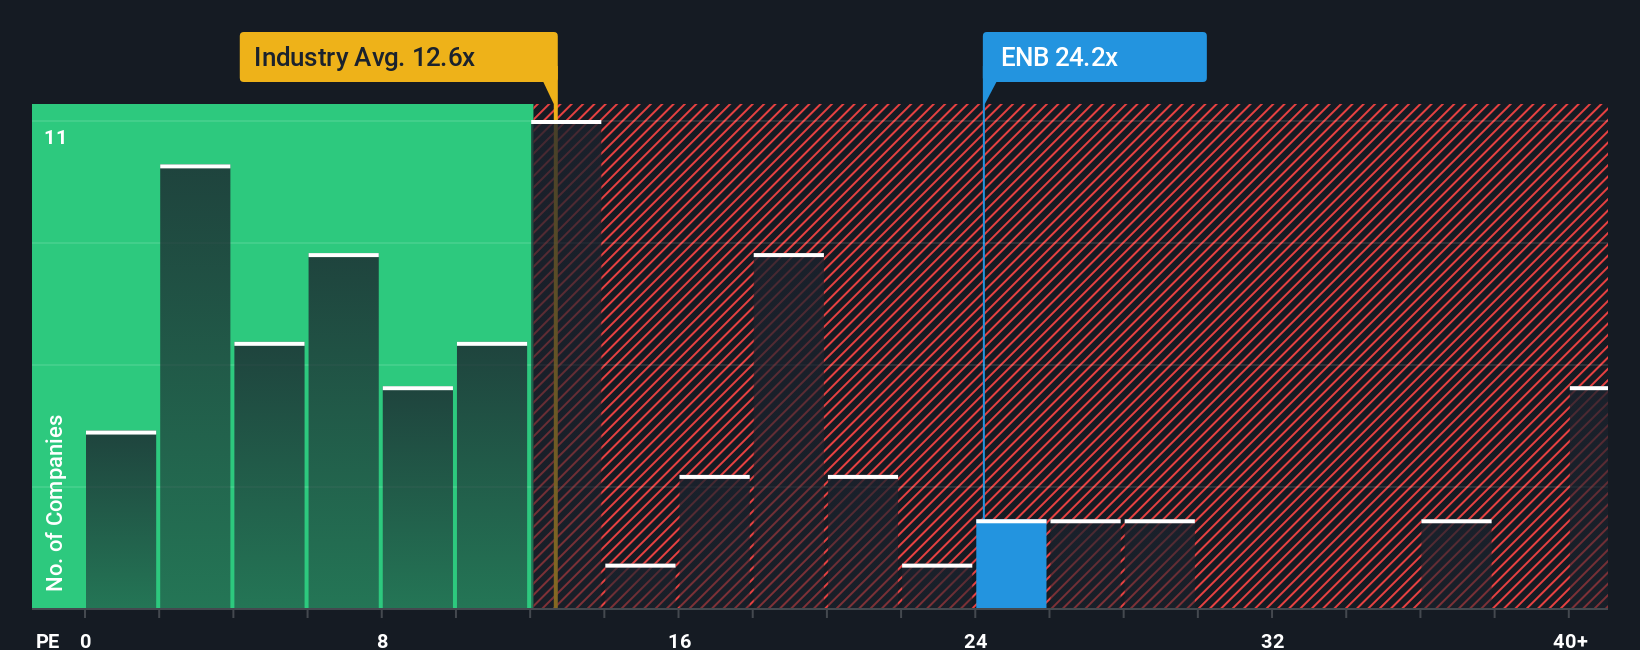
Currently, Enbridge trades at a PE ratio of 24.3x. Compared to the Oil and Gas industry average PE of 12.3x and a peer group average of 19.3x, Enbridge appears to be priced at a higher multiple. However, these comparisons only offer a partial picture of value.
To go deeper, Simply Wall St’s proprietary “Fair Ratio” factors in not just Enbridge’s growth and profit margins, but also industry dynamics, company size, and risks. For Enbridge, the Fair PE Ratio is calculated at 17.8x. This reflects what investors might reasonably expect given all these elements together. This tailored ratio is generally more insightful than broad-brush peer or sector averages because it takes a wider set of company-specific and industry factors into account.
With a current PE of 24.3x versus a Fair Ratio of 17.8x, Enbridge’s shares are priced above what would be considered fair value by this analysis. This suggests the stock is overvalued on earnings grounds.
Result: OVERVALUED
PE ratios tell one story, but what if the real opportunity lies elsewhere? Discover companies where insiders are betting big on explosive growth.
Upgrade Your Decision Making: Choose your Enbridge Narrative
Earlier we mentioned that there is an even better way to understand valuation, so let us introduce you to Narratives, a smarter, more personal approach to making investment decisions. Narratives allow you to tie your own perspective on a company, such as Enbridge, directly to financial forecasts, making sense of fair value estimates and future revenue or earnings in the context of the bigger story. With Narratives, you are not just crunching numbers; you are creating a living, dynamic story that connects the company’s business model, risks, trends, and future expectations, ultimately leading to a fair value that matches your outlook.
This powerful tool is available for free on Simply Wall St’s Community page and is used by millions of investors to track, update, and compare investment stories for thousands of companies. Narratives bridge the gap between what you believe about Enbridge’s future and the numbers, helping you decide whether to buy, hold, or sell by directly comparing your Fair Value estimate with the current share price. Importantly, Narratives update automatically when new earnings, news, or events change the investment case, keeping your perspective fresh and informed.
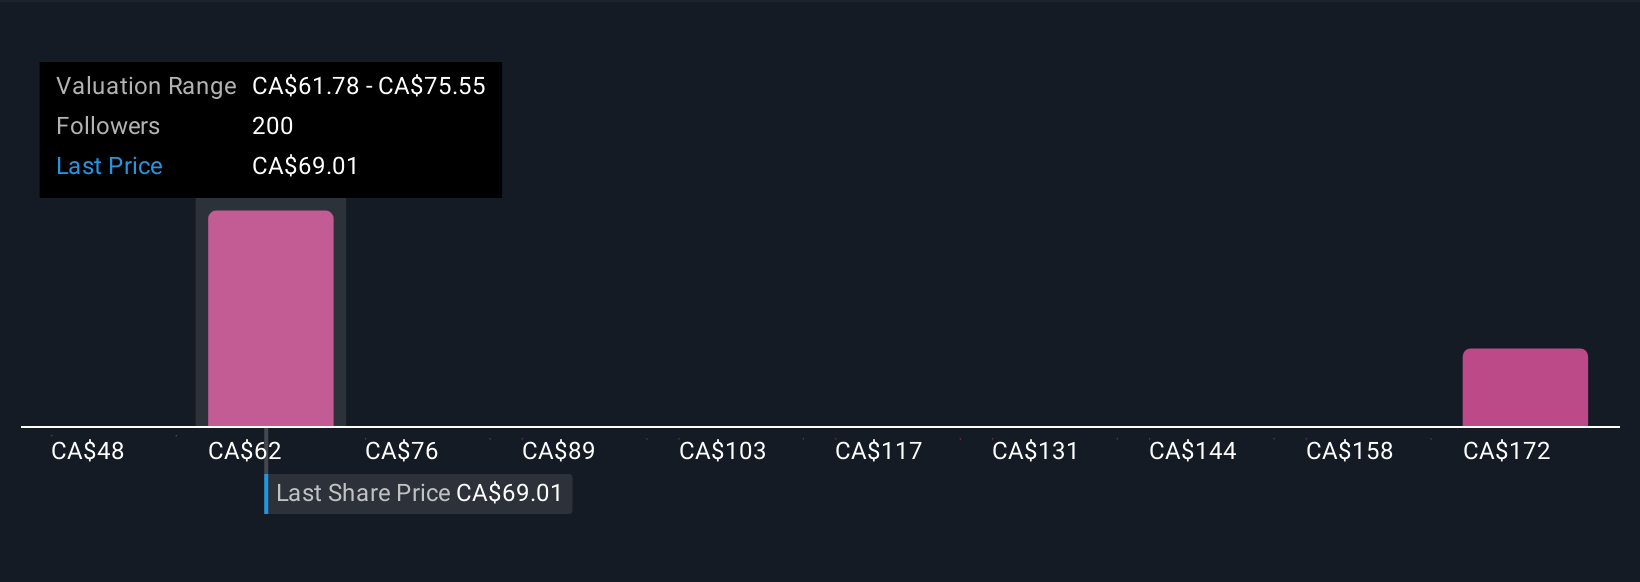
For example, one investor may believe Enbridge will thrive on stable cash flows and energy demand, setting a bullish fair value near CA$77.00. Another might focus on regulatory and decarbonization risks, assigning a more cautious value around CA$60.00. Using Narratives, both can clearly articulate, justify, and share their views, and you can build your own too.
Do you think there's more to the story for Enbridge? Create your own Narrative to let the Community know!
This article by Simply Wall St is general in nature. We provide commentary based on historical data and analyst forecasts only using an unbiased methodology and our articles are not intended to be financial advice. It does not constitute a recommendation to buy or sell any stock, and does not take account of your objectives, or your financial situation. We aim to bring you long-term focused analysis driven by fundamental data. Note that our analysis may not factor in the latest price-sensitive company announcements or qualitative material. Simply Wall St has no position in any stocks mentioned.
Valuation is complex, but we're here to simplify it.
Discover if Enbridge might be undervalued or overvalued with our detailed analysis, featuring fair value estimates, potential risks, dividends, insider trades, and its financial condition.
Access Free AnalysisHave feedback on this article? Concerned about the content? Get in touch with us directly. Alternatively, email editorial-team@simplywallst.com
About TSX:ENB
Proven track record second-rate dividend payer.
Similar Companies
Market Insights

Advertisement
Community Narratives
The Next Phase of Energy Storage: How NeoVolta Is Tackling America’s Power Crunch
Fair Value US$7.50|35.2% undervalued
MA
Community Contributor
Why EnSilica is Worth Possibly 13x its Current Price
Fair Value UK£5.00|90.0% undervalued
DO
Community Contributor
M&A Activity, Industry Diversification & A Defense Contract Monopoly Will Push BWXT For Healthy Long-Term Growth
Fair Value US$220.00|15.6% undervalued
CL
Community Contributor
A case for Cassiar Gold Corp (TSXV: GLDC) to reach CAD$8-10 before 2030 (X30-37)
Fair Value CA$10.00|97.1% undervalued
AG
Community Contributor