
Advertisement
- Canada
- /
- Energy Services
- /
- TSX:ACX
Are Strong Financial Prospects The Force That Is Driving The Momentum In ACT Energy Technologies Ltd.'s TSE:ACX) Stock?
ACT Energy Technologies (TSE:ACX) has had a great run on the share market with its stock up by a significant 11% over the last week. Given that the market rewards strong financials in the long-term, we wonder if that is the case in this instance. Particularly, we will be paying attention to ACT Energy Technologies' ROE today.
Return on Equity or ROE is a test of how effectively a company is growing its value and managing investors’ money. Put another way, it reveals the company's success at turning shareholder investments into profits.
See our latest analysis for ACT Energy Technologies
How Is ROE Calculated?
Return on equity can be calculated by using the formula:
Return on Equity = Net Profit (from continuing operations) ÷ Shareholders' Equity
So, based on the above formula, the ROE for ACT Energy Technologies is:
12% = CA$24m ÷ CA$201m (Based on the trailing twelve months to June 2024).
The 'return' is the profit over the last twelve months. That means that for every CA$1 worth of shareholders' equity, the company generated CA$0.12 in profit.
What Has ROE Got To Do With Earnings Growth?
So far, we've learned that ROE is a measure of a company's profitability. Based on how much of its profits the company chooses to reinvest or "retain", we are then able to evaluate a company's future ability to generate profits. Assuming all else is equal, companies that have both a higher return on equity and higher profit retention are usually the ones that have a higher growth rate when compared to companies that don't have the same features.
ACT Energy Technologies' Earnings Growth And 12% ROE
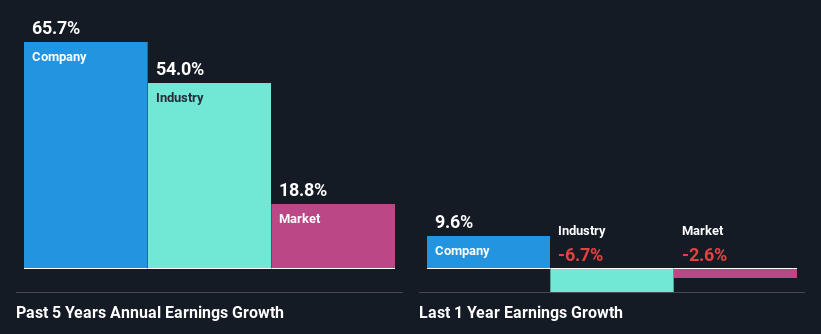
At first glance, ACT Energy Technologies seems to have a decent ROE. Even so, when compared with the average industry ROE of 16%, we aren't very excited. That being the case, the significant five-year 66% net income growth reported by ACT Energy Technologies comes as a pleasant surprise. We believe that there might be other aspects that are positively influencing the company's earnings growth. For instance, the company has a low payout ratio or is being managed efficiently. Bear in mind, the company does have a respectable ROE. It is just that the industry ROE is higher. So this certainly also provides some context to the high earnings growth seen by the company.
We then compared ACT Energy Technologies' net income growth with the industry and we're pleased to see that the company's growth figure is higher when compared with the industry which has a growth rate of 54% in the same 5-year period.
Earnings growth is a huge factor in stock valuation. It’s important for an investor to know whether the market has priced in the company's expected earnings growth (or decline). Doing so will help them establish if the stock's future looks promising or ominous. One good indicator of expected earnings growth is the P/E ratio which determines the price the market is willing to pay for a stock based on its earnings prospects. So, you may want to check if ACT Energy Technologies is trading on a high P/E or a low P/E, relative to its industry.
Is ACT Energy Technologies Making Efficient Use Of Its Profits?
ACT Energy Technologies doesn't pay any regular dividends to its shareholders, meaning that the company has been reinvesting all of its profits into the business. This is likely what's driving the high earnings growth number discussed above.
Conclusion
Overall, we are quite pleased with ACT Energy Technologies' performance. Particularly, we like that the company is reinvesting heavily into its business at a moderate rate of return. Unsurprisingly, this has led to an impressive earnings growth. We also studied the latest analyst forecasts and found that the company's earnings growth is expected be similar to its current growth rate. To know more about the latest analysts predictions for the company, check out this visualization of analyst forecasts for the company.
New: Manage All Your Stock Portfolios in One Place
We've created the ultimate portfolio companion for stock investors, and it's free.
• Connect an unlimited number of Portfolios and see your total in one currency
• Be alerted to new Warning Signs or Risks via email or mobile
• Track the Fair Value of your stocks
Have feedback on this article? Concerned about the content? Get in touch with us directly. Alternatively, email editorial-team (at) simplywallst.com.
This article by Simply Wall St is general in nature. We provide commentary based on historical data and analyst forecasts only using an unbiased methodology and our articles are not intended to be financial advice. It does not constitute a recommendation to buy or sell any stock, and does not take account of your objectives, or your financial situation. We aim to bring you long-term focused analysis driven by fundamental data. Note that our analysis may not factor in the latest price-sensitive company announcements or qualitative material. Simply Wall St has no position in any stocks mentioned.
About TSX:ACX
ACT Energy Technologies
Provides directional drilling services to oil and natural gas companies in Canada and the United States.
Very undervalued with excellent balance sheet.
Similar Companies
Market Insights

Advertisement
Community Narratives
Finding The True Value Of A Logistics Powerhouse
Fair Value US$95.21|8.5% undervalued
NV
Community Contributor
Paradigm Biopharmaceuticals Will Lead Osteoarthritis Treatment with Zilosul's FDA Success
Fair Value AU$5.50|91.9% undervalued
AM
Community Contributor
Barrick Mining (ABX:CA): A Gold Hedge against a U.S. Shutdown
Fair Value CA$60.00|26.5% undervalued
GM
Community Contributor