
Advertisement
- Canada
- /
- Oil and Gas
- /
- CNSX:TCF
Investors Give Trillion Energy International Inc. (CSE:TCF) Shares A 29% Hiding

To the annoyance of some shareholders, Trillion Energy International Inc. (CSE:TCF) shares are down a considerable 29% in the last month, which continues a horrid run for the company. The recent drop completes a disastrous twelve months for shareholders, who are sitting on a 91% loss during that time.
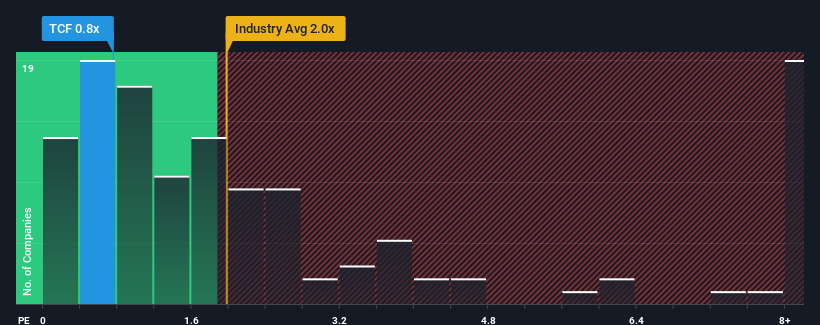
After such a large drop in price, Trillion Energy International may be sending buy signals at present with its price-to-sales (or "P/S") ratio of 0.8x, considering almost half of all companies in the Oil and Gas industry in Canada have P/S ratios greater than 2x and even P/S higher than 5x aren't out of the ordinary. Nonetheless, we'd need to dig a little deeper to determine if there is a rational basis for the reduced P/S.
View our latest analysis for Trillion Energy International
How Has Trillion Energy International Performed Recently?
Trillion Energy International could be doing better as it's been growing revenue less than most other companies lately. Perhaps the market is expecting the current trend of poor revenue growth to continue, which has kept the P/S suppressed. If this is the case, then existing shareholders will probably struggle to get excited about the future direction of the share price.
Keen to find out how analysts think Trillion Energy International's future stacks up against the industry? In that case, our free report is a great place to start.Is There Any Revenue Growth Forecasted For Trillion Energy International?
The only time you'd be truly comfortable seeing a P/S as low as Trillion Energy International's is when the company's growth is on track to lag the industry.
Retrospectively, the last year delivered an explosive gain to the company's top line. Spectacularly, three year revenue growth has also set the world alight, thanks to the last 12 months of incredible growth. So we can start by confirming that the company has done a tremendous job of growing revenue over that time.
Shifting to the future, estimates from the lone analyst covering the company suggest revenue should grow by 524% over the next year. With the industry only predicted to deliver 10%, the company is positioned for a stronger revenue result.
With this information, we find it odd that Trillion Energy International is trading at a P/S lower than the industry. It looks like most investors are not convinced at all that the company can achieve future growth expectations.
The Bottom Line On Trillion Energy International's P/S
Trillion Energy International's P/S has taken a dip along with its share price. While the price-to-sales ratio shouldn't be the defining factor in whether you buy a stock or not, it's quite a capable barometer of revenue expectations.
A look at Trillion Energy International's revenues reveals that, despite glowing future growth forecasts, its P/S is much lower than we'd expect. When we see strong growth forecasts like this, we can only assume potential risks are what might be placing significant pressure on the P/S ratio. It appears the market could be anticipating revenue instability, because these conditions should normally provide a boost to the share price.
Having said that, be aware Trillion Energy International is showing 5 warning signs in our investment analysis, and 3 of those shouldn't be ignored.
If these risks are making you reconsider your opinion on Trillion Energy International, explore our interactive list of high quality stocks to get an idea of what else is out there.
Valuation is complex, but we're here to simplify it.
Discover if Trillion Energy International might be undervalued or overvalued with our detailed analysis, featuring fair value estimates, potential risks, dividends, insider trades, and its financial condition.
Access Free AnalysisHave feedback on this article? Concerned about the content? Get in touch with us directly. Alternatively, email editorial-team (at) simplywallst.com.
This article by Simply Wall St is general in nature. We provide commentary based on historical data and analyst forecasts only using an unbiased methodology and our articles are not intended to be financial advice. It does not constitute a recommendation to buy or sell any stock, and does not take account of your objectives, or your financial situation. We aim to bring you long-term focused analysis driven by fundamental data. Note that our analysis may not factor in the latest price-sensitive company announcements or qualitative material. Simply Wall St has no position in any stocks mentioned.
About CNSX:TCF
Trillion Energy International
An oil and gas exploration and production company with operations in Turkey and Bulgaria.
Moderate and good value.
Similar Companies
Market Insights

Advertisement
Community Narratives
Pinterest will surge as advertising innovations ignite revenue growth
Fair Value US$42.63|27.0% undervalued
BR
Community Contributor
Brambles' Revenue Set to Climb 14% with Profit Margins Following
Fair Value AU$21.90|5.9% overvalued
RO
Community Contributor
Challenging Future for STG as Organic Sales Decline by 8.8%
Fair Value DKK 116.13|26.8% undervalued
KA
Community Contributor