- Canada
- /
- Energy Services
- /
- CNSX:BHCC
Estimating The Fair Value Of Blue Horizon Global Capital Corp. (CSE:BHCC)


Key Insights
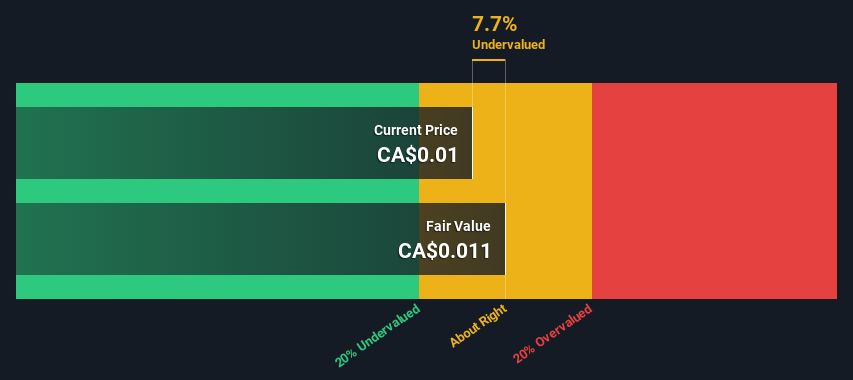
- Blue Horizon Global Capital's estimated fair value is CA$0.011 based on 2 Stage Free Cash Flow to Equity
- Current share price of CA$0.01 suggests Blue Horizon Global Capital is potentially trading close to its fair value
- Industry average discount to fair value of 50% suggests Blue Horizon Global Capital's peers are currently trading at a higher discount
In this article we are going to estimate the intrinsic value of Blue Horizon Global Capital Corp. (CSE:BHCC) by projecting its future cash flows and then discounting them to today's value. We will use the Discounted Cash Flow (DCF) model on this occasion. Models like these may appear beyond the comprehension of a lay person, but they're fairly easy to follow.
Companies can be valued in a lot of ways, so we would point out that a DCF is not perfect for every situation. For those who are keen learners of equity analysis, the Simply Wall St analysis model here may be something of interest to you.
Check out our latest analysis for Blue Horizon Global Capital
What's The Estimated Valuation?
We use what is known as a 2-stage model, which simply means we have two different periods of growth rates for the company's cash flows. Generally the first stage is higher growth, and the second stage is a lower growth phase. To start off with, we need to estimate the next ten years of cash flows. Seeing as no analyst estimates of free cash flow are available to us, we have extrapolate the previous free cash flow (FCF) from the company's last reported value. We assume companies with shrinking free cash flow will slow their rate of shrinkage, and that companies with growing free cash flow will see their growth rate slow, over this period. We do this to reflect that growth tends to slow more in the early years than it does in later years.
Generally we assume that a dollar today is more valuable than a dollar in the future, and so the sum of these future cash flows is then discounted to today's value:
10-year free cash flow (FCF) forecast
| 2025 | 2026 | 2027 | 2028 | 2029 | 2030 | 2031 | 2032 | 2033 | 2034 | |
| Levered FCF (CA$, Millions) | CA$151.5k | CA$183.1k | CA$211.0k | CA$235.0k | CA$255.2k | CA$272.2k | CA$286.7k | CA$299.2k | CA$310.4k | CA$320.5k |
| Growth Rate Estimate Source | Est @ 28.89% | Est @ 20.88% | Est @ 15.27% | Est @ 11.34% | Est @ 8.59% | Est @ 6.67% | Est @ 5.32% | Est @ 4.38% | Est @ 3.72% | Est @ 3.26% |
| Present Value (CA$, Millions) Discounted @ 7.5% | CA$0.1 | CA$0.2 | CA$0.2 | CA$0.2 | CA$0.2 | CA$0.2 | CA$0.2 | CA$0.2 | CA$0.2 | CA$0.2 |
("Est" = FCF growth rate estimated by Simply Wall St)
Present Value of 10-year Cash Flow (PVCF) = CA$1.7m
After calculating the present value of future cash flows in the initial 10-year period, we need to calculate the Terminal Value, which accounts for all future cash flows beyond the first stage. For a number of reasons a very conservative growth rate is used that cannot exceed that of a country's GDP growth. In this case we have used the 5-year average of the 10-year government bond yield (2.2%) to estimate future growth. In the same way as with the 10-year 'growth' period, we discount future cash flows to today's value, using a cost of equity of 7.5%.
Terminal Value (TV)= FCF2034 × (1 + g) ÷ (r – g) = CA$320k× (1 + 2.2%) ÷ (7.5%– 2.2%) = CA$6.2m
Present Value of Terminal Value (PVTV)= TV / (1 + r)10= CA$6.2m÷ ( 1 + 7.5%)10= CA$3.0m
The total value is the sum of cash flows for the next ten years plus the discounted terminal value, which results in the Total Equity Value, which in this case is CA$4.6m. In the final step we divide the equity value by the number of shares outstanding. Relative to the current share price of CA$0.01, the company appears about fair value at a 7.7% discount to where the stock price trades currently. The assumptions in any calculation have a big impact on the valuation, so it is better to view this as a rough estimate, not precise down to the last cent.
The Assumptions
Now the most important inputs to a discounted cash flow are the discount rate, and of course, the actual cash flows. You don't have to agree with these inputs, I recommend redoing the calculations yourself and playing with them. The DCF also does not consider the possible cyclicality of an industry, or a company's future capital requirements, so it does not give a full picture of a company's potential performance. Given that we are looking at Blue Horizon Global Capital as potential shareholders, the cost of equity is used as the discount rate, rather than the cost of capital (or weighted average cost of capital, WACC) which accounts for debt. In this calculation we've used 7.5%, which is based on a levered beta of 1.290. Beta is a measure of a stock's volatility, compared to the market as a whole. We get our beta from the industry average beta of globally comparable companies, with an imposed limit between 0.8 and 2.0, which is a reasonable range for a stable business.
SWOT Analysis for Blue Horizon Global Capital
- Debt is well covered by earnings and cashflows.
- Shareholders have been diluted in the past year.
- Has sufficient cash runway for more than 3 years based on current free cash flows.
- Current share price is below our estimate of fair value.
- Lack of analyst coverage makes it difficult to determine BHCC's earnings prospects.
- Total liabilities exceed total assets, which raises the risk of financial distress.
Moving On:
Although the valuation of a company is important, it ideally won't be the sole piece of analysis you scrutinize for a company. DCF models are not the be-all and end-all of investment valuation. Instead the best use for a DCF model is to test certain assumptions and theories to see if they would lead to the company being undervalued or overvalued. If a company grows at a different rate, or if its cost of equity or risk free rate changes sharply, the output can look very different. For Blue Horizon Global Capital, we've compiled three important elements you should consider:
- Risks: To that end, you should be aware of the 6 warning signs we've spotted with Blue Horizon Global Capital .
- Other Solid Businesses: Low debt, high returns on equity and good past performance are fundamental to a strong business. Why not explore our interactive list of stocks with solid business fundamentals to see if there are other companies you may not have considered!
- Other Environmentally-Friendly Companies: Concerned about the environment and think consumers will buy eco-friendly products more and more? Browse through our interactive list of companies that are thinking about a greener future to discover some stocks you may not have thought of!
PS. The Simply Wall St app conducts a discounted cash flow valuation for every stock on the CNSX every day. If you want to find the calculation for other stocks just search here.
If you're looking to trade Blue Horizon Global Capital, open an account with the lowest-cost platform trusted by professionals, Interactive Brokers.
With clients in over 200 countries and territories, and access to 160 markets, IBKR lets you trade stocks, options, futures, forex, bonds and funds from a single integrated account.
Enjoy no hidden fees, no account minimums, and FX conversion rates as low as 0.03%, far better than what most brokers offer.
Sponsored ContentValuation is complex, but we're here to simplify it.
Discover if Blue Horizon Global Capital might be undervalued or overvalued with our detailed analysis, featuring fair value estimates, potential risks, dividends, insider trades, and its financial condition.
Access Free AnalysisHave feedback on this article? Concerned about the content? Get in touch with us directly. Alternatively, email editorial-team (at) simplywallst.com.
This article by Simply Wall St is general in nature. We provide commentary based on historical data and analyst forecasts only using an unbiased methodology and our articles are not intended to be financial advice. It does not constitute a recommendation to buy or sell any stock, and does not take account of your objectives, or your financial situation. We aim to bring you long-term focused analysis driven by fundamental data. Note that our analysis may not factor in the latest price-sensitive company announcements or qualitative material. Simply Wall St has no position in any stocks mentioned.
About CNSX:BHCC
Blue Horizon Global Capital
Operates as a diversified investment and merchant banking firm with focus on public companies and commodities.
Medium-low with weak fundamentals.
Market Insights

Community Narratives

