
Advertisement
- Canada
- /
- Food and Staples Retail
- /
- TSX:EMP.A
Despite Its High P/E Ratio, Is Empire Company Limited (TSE:EMP.A) Still Undervalued?

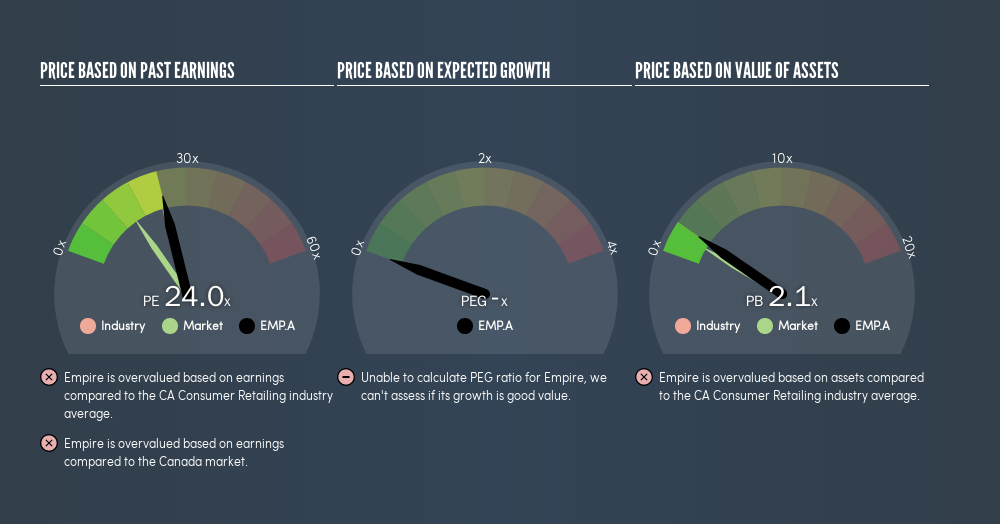
This article is written for those who want to get better at using price to earnings ratios (P/E ratios). To keep it practical, we'll show how Empire Company Limited's (TSE:EMP.A) P/E ratio could help you assess the value on offer. Looking at earnings over the last twelve months, Empire has a P/E ratio of 24.04. That corresponds to an earnings yield of approximately 4.2%.
See our latest analysis for Empire
How Do You Calculate A P/E Ratio?
The formula for P/E is:
Price to Earnings Ratio = Price per Share ÷ Earnings per Share (EPS)
Or for Empire:
P/E of 24.04 = CA$29.73 ÷ CA$1.24 (Based on the trailing twelve months to February 2019.)
Is A High P/E Ratio Good?
A higher P/E ratio implies that investors pay a higher price for the earning power of the business. That isn't necessarily good or bad, but a high P/E implies relatively high expectations of what a company can achieve in the future.
How Growth Rates Impact P/E Ratios
Probably the most important factor in determining what P/E a company trades on is the earnings growth. Earnings growth means that in the future the 'E' will be higher. That means unless the share price increases, the P/E will reduce in a few years. A lower P/E should indicate the stock is cheap relative to others -- and that may attract buyers.
In the last year, Empire grew EPS like Taylor Swift grew her fan base back in 2010; the 186% gain was both fast and well deserved.
Does Empire Have A Relatively High Or Low P/E For Its Industry?
The P/E ratio essentially measures market expectations of a company. As you can see below Empire has a P/E ratio that is fairly close for the average for the consumer retailing industry, which is 23.3.
Empire's P/E tells us that market participants think its prospects are roughly in line with its industry. So if Empire actually outperforms its peers going forward, that should be a positive for the share price. Checking factors such as the tenure of the board and management could help you form your own view on if that will happen.
A Limitation: P/E Ratios Ignore Debt and Cash In The Bank
The 'Price' in P/E reflects the market capitalization of the company. Thus, the metric does not reflect cash or debt held by the company. Hypothetically, a company could reduce its future P/E ratio by spending its cash (or taking on debt) to achieve higher earnings.
Such spending might be good or bad, overall, but the key point here is that you need to look at debt to understand the P/E ratio in context.
So What Does Empire's Balance Sheet Tell Us?
Empire has net debt worth 20% of its market capitalization. This could bring some additional risk, and reduce the number of investment options for management; worth remembering if you compare its P/E to businesses without debt.
The Bottom Line On Empire's P/E Ratio
Empire has a P/E of 24. That's higher than the average in the CA market, which is 15.1. Its debt levels do not imperil its balance sheet and its EPS growth is very healthy indeed. So to be frank we are not surprised it has a high P/E ratio.
Investors have an opportunity when market expectations about a stock are wrong. If the reality for a company is better than it expects, you can make money by buying and holding for the long term. So this freereport on the analyst consensus forecasts could help you make a master move on this stock.
But note: Empire may not be the best stock to buy. So take a peek at this freelist of interesting companies with strong recent earnings growth (and a P/E ratio below 20).
We aim to bring you long-term focused research analysis driven by fundamental data. Note that our analysis may not factor in the latest price-sensitive company announcements or qualitative material.
If you spot an error that warrants correction, please contact the editor at editorial-team@simplywallst.com. This article by Simply Wall St is general in nature. It does not constitute a recommendation to buy or sell any stock, and does not take account of your objectives, or your financial situation. Simply Wall St has no position in the stocks mentioned. Thank you for reading.
About TSX:EMP.A
Empire
Engages in the food retail and related real estate businesses in Canada.
Adequate balance sheet average dividend payer.
Similar Companies
Market Insights


Advertisement
Community Narratives
The Future of Drug Testing? Fingerprint Tech Shows Serious Promise
Fair Value US$2.98|40.3% undervalued
JO
Community Contributor
Suncorp’s Next Chapter: Insurance-Only and Ready to Grow
Fair Value AU$22.83|7.6% undervalued
RO
Community Contributor
Thyssenkrupp Nucera Will Achieve Double-Digit Profits by 2030 Boosted by Hydrogen Growth
Fair Value €14.40|30.6% undervalued
CH
Community Contributor
Tesla’s Nvidia Moment – The AI & Robotics Inflection Point
Fair Value US$359.72|12.3% undervalued
BL
Community Contributor