
Advertisement
- Canada
- /
- Construction
- /
- TSX:WSP
WSP Global (TSE:WSP) shareholders have earned a 28% CAGR over the last five years

The most you can lose on any stock (assuming you don't use leverage) is 100% of your money. But when you pick a company that is really flourishing, you can make more than 100%. For example, the WSP Global Inc. (TSE:WSP) share price has soared 229% in the last half decade. Most would be very happy with that. On top of that, the share price is up 10% in about a quarter. But this could be related to the strong market, which is up 5.9% in the last three months.
Let's take a look at the underlying fundamentals over the longer term, and see if they've been consistent with shareholders returns.
In his essay The Superinvestors of Graham-and-Doddsville Warren Buffett described how share prices do not always rationally reflect the value of a business. One way to examine how market sentiment has changed over time is to look at the interaction between a company's share price and its earnings per share (EPS).
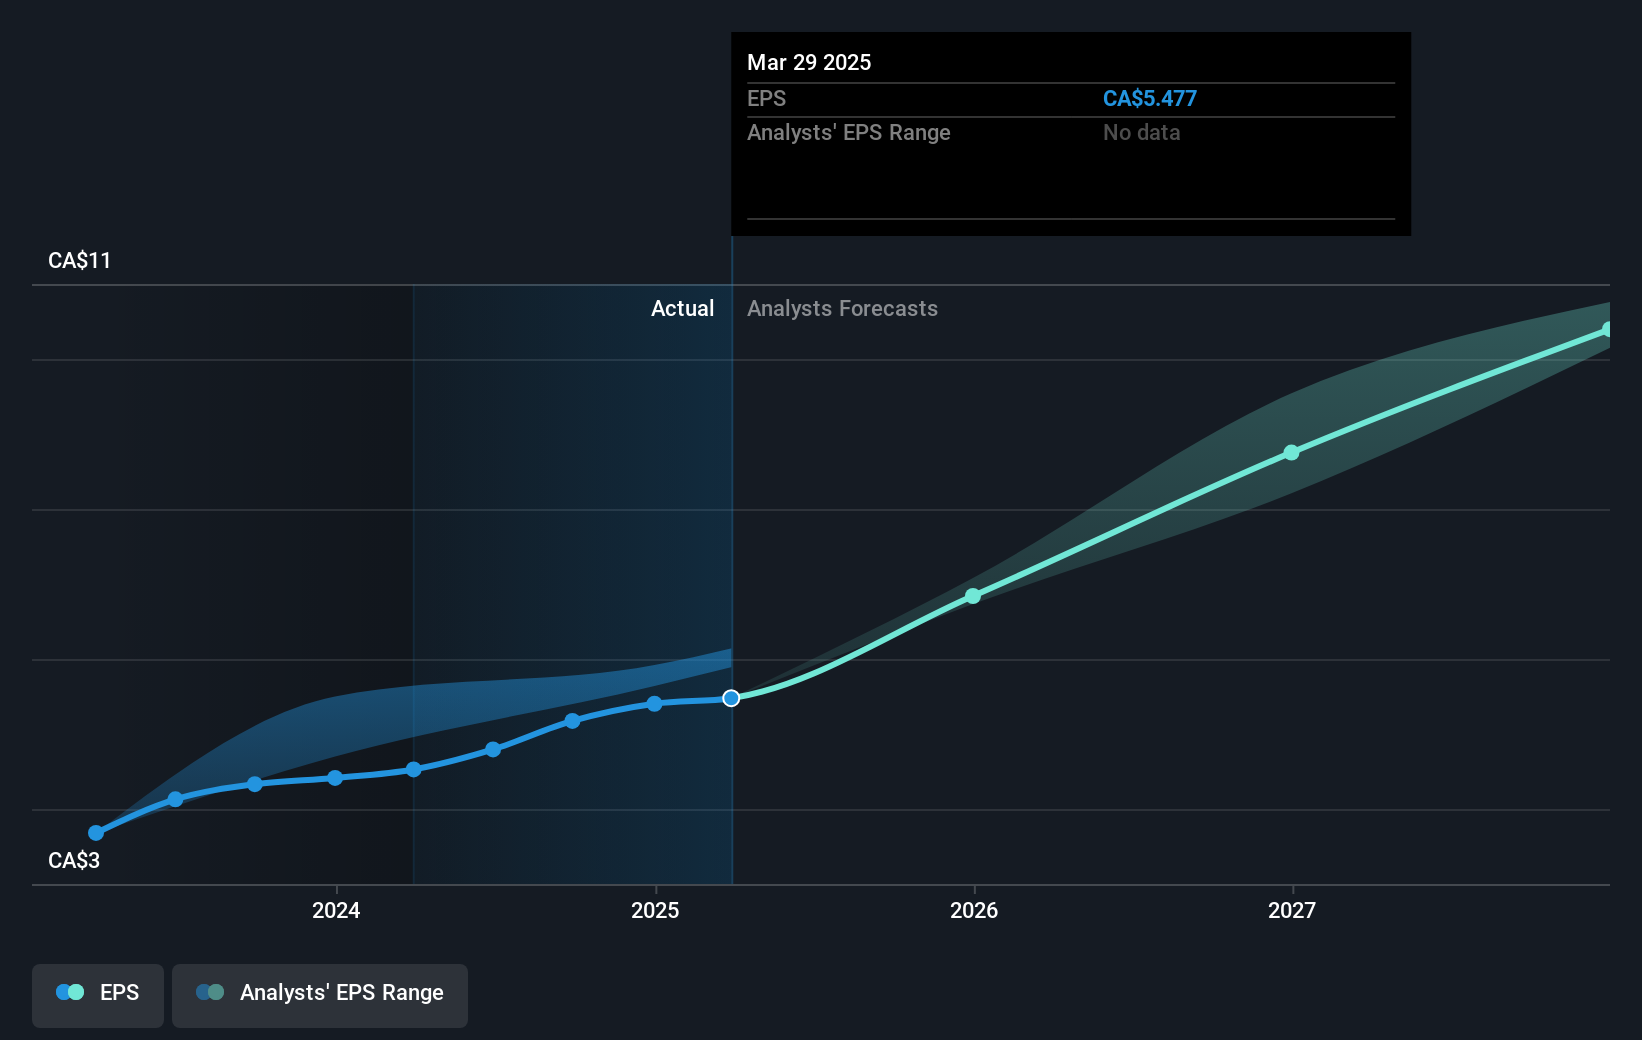
During five years of share price growth, WSP Global achieved compound earnings per share (EPS) growth of 19% per year. This EPS growth is lower than the 27% average annual increase in the share price. This suggests that market participants hold the company in higher regard, these days. And that's hardly shocking given the track record of growth. This optimism is visible in its fairly high P/E ratio of 51.16.
The graphic below depicts how EPS has changed over time (unveil the exact values by clicking on the image).
We like that insiders have been buying shares in the last twelve months. Having said that, most people consider earnings and revenue growth trends to be a more meaningful guide to the business. It might be well worthwhile taking a look at our free report on WSP Global's earnings, revenue and cash flow.
What About Dividends?
When looking at investment returns, it is important to consider the difference between total shareholder return (TSR) and share price return. The TSR is a return calculation that accounts for the value of cash dividends (assuming that any dividend received was reinvested) and the calculated value of any discounted capital raisings and spin-offs. Arguably, the TSR gives a more comprehensive picture of the return generated by a stock. As it happens, WSP Global's TSR for the last 5 years was 244%, which exceeds the share price return mentioned earlier. The dividends paid by the company have thusly boosted the total shareholder return.
A Different Perspective
It's good to see that WSP Global has rewarded shareholders with a total shareholder return of 31% in the last twelve months. That's including the dividend. That gain is better than the annual TSR over five years, which is 28%. Therefore it seems like sentiment around the company has been positive lately. Someone with an optimistic perspective could view the recent improvement in TSR as indicating that the business itself is getting better with time. It's always interesting to track share price performance over the longer term. But to understand WSP Global better, we need to consider many other factors. For instance, we've identified 1 warning sign for WSP Global that you should be aware of.
WSP Global is not the only stock that insiders are buying. For those who like to find lesser know companies this free list of growing companies with recent insider purchasing, could be just the ticket.
Please note, the market returns quoted in this article reflect the market weighted average returns of stocks that currently trade on Canadian exchanges.
Valuation is complex, but we're here to simplify it.
Discover if WSP Global might be undervalued or overvalued with our detailed analysis, featuring fair value estimates, potential risks, dividends, insider trades, and its financial condition.
Access Free AnalysisHave feedback on this article? Concerned about the content? Get in touch with us directly. Alternatively, email editorial-team (at) simplywallst.com.
This article by Simply Wall St is general in nature. We provide commentary based on historical data and analyst forecasts only using an unbiased methodology and our articles are not intended to be financial advice. It does not constitute a recommendation to buy or sell any stock, and does not take account of your objectives, or your financial situation. We aim to bring you long-term focused analysis driven by fundamental data. Note that our analysis may not factor in the latest price-sensitive company announcements or qualitative material. Simply Wall St has no position in any stocks mentioned.
About TSX:WSP
WSP Global
Operates as a professional services consulting firm in the United States, Canada, the United Kingdom, Sweden, Australia, and internationally.
Solid track record with excellent balance sheet.
Similar Companies
Market Insights

Advertisement
Community Narratives
A case for TSXV:USA to reach USD $5.00 - $9.00 (CAD $7.30–$12.29) by 2029.
Fair Value CA$12.29|91.5% undervalued
AG
Community Contributor
DLocal's Future Growth Fueled by 35% Revenue and Profit Margin Boosts
Fair Value US$195.39|94.4% undervalued
WY
Community Contributor
Historically Cheap, but the Margin of Safety Is Still Thin
Fair Value SEK 232.58|15.3% undervalued
MA
Community Contributor