
This article will reflect on the compensation paid to Andrew R. Moor who has served as CEO of Equitable Group Inc. (TSE:EQB) since 2007. This analysis will also evaluate the appropriateness of CEO compensation when taking into account the earnings and shareholder returns of the company.
View our latest analysis for Equitable Group
How Does Total Compensation For Andrew R. Moor Compare With Other Companies In The Industry?
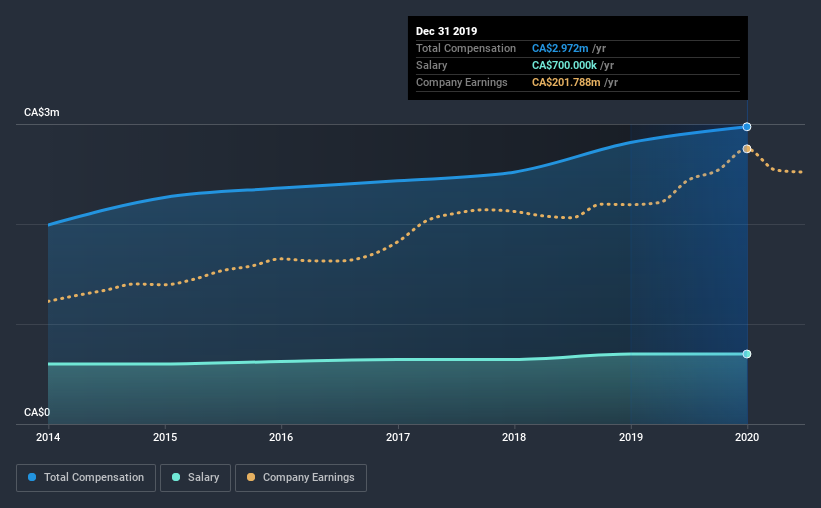
Our data indicates that Equitable Group Inc. has a market capitalization of CA$1.3b, and total annual CEO compensation was reported as CA$3.0m for the year to December 2019. That's a modest increase of 5.6% on the prior year. While this analysis focuses on total compensation, it's worth acknowledging that the salary portion is lower, valued at CA$700k.
For comparison, other companies in the same industry with market capitalizations ranging between CA$536m and CA$2.1b had a median total CEO compensation of CA$2.6m. This suggests that Equitable Group remunerates its CEO largely in line with the industry average. Furthermore, Andrew R. Moor directly owns CA$16m worth of shares in the company, implying that they are deeply invested in the company's success.
| Component | 2019 | 2018 | Proportion (2019) |
| Salary | CA$700k | CA$700k | 24% |
| Other | CA$2.3m | CA$2.1m | 76% |
| Total Compensation | CA$3.0m | CA$2.8m | 100% |
On an industry level, roughly 47% of total compensation represents salary and 53% is other remuneration. In Equitable Group's case, non-salary compensation represents a greater slice of total remuneration, in comparison to the broader industry. If total compensation is slanted towards non-salary benefits, it indicates that CEO pay is linked to company performance.
A Look at Equitable Group Inc.'s Growth Numbers
Equitable Group Inc. has seen its earnings per share (EPS) increase by 4.6% a year over the past three years. Its revenue is up 11% over the last year.
We would argue that the modest growth in revenue is a notable positive. And the improvement in EPSis modest but respectable. So while we'd stop just short of calling this a top performer, but we think it is well worth watching. Historical performance can sometimes be a good indicator on what's coming up next but if you want to peer into the company's future you might be interested in this free visualization of analyst forecasts.
Has Equitable Group Inc. Been A Good Investment?
Most shareholders would probably be pleased with Equitable Group Inc. for providing a total return of 41% over three years. This strong performance might mean some shareholders don't mind if the CEO were to be paid more than is normal for a company of its size.
To Conclude...
As previously discussed, Andrew R. is compensated close to the median for companies of its size, and which belong to the same industry. However, the company's EPS growth numbers over the last three years is not that impressive. Meanwhile, shareholder returns have remained positive over the same time frame. We would like to see EPS growth from the business, although we wouldn't say the CEO compensation is high.
While it is important to pay attention to CEO remuneration, investors should also consider other elements of the business. That's why we did some digging and identified 1 warning sign for Equitable Group that investors should think about before committing capital to this stock.
Arguably, business quality is much more important than CEO compensation levels. So check out this free list of interesting companies that have HIGH return on equity and low debt.
When trading Equitable Group or any other investment, use the platform considered by many to be the Professional's Gateway to the Worlds Market, Interactive Brokers. You get the lowest-cost* trading on stocks, options, futures, forex, bonds and funds worldwide from a single integrated account. Promoted
Mobile Infrastructure for Defense and Disaster
The next wave in robotics isn't humanoid. Its fully autonomous towers delivering 5G, ISR, and radar in under 30 minutes, anywhere.
Get the investor briefing before the next round of contracts
Sponsored On Behalf of CiTechValuation is complex, but we're here to simplify it.
Discover if EQB might be undervalued or overvalued with our detailed analysis, featuring fair value estimates, potential risks, dividends, insider trades, and its financial condition.
Access Free AnalysisThis article by Simply Wall St is general in nature. It does not constitute a recommendation to buy or sell any stock, and does not take account of your objectives, or your financial situation. We aim to bring you long-term focused analysis driven by fundamental data. Note that our analysis may not factor in the latest price-sensitive company announcements or qualitative material. Simply Wall St has no position in any stocks mentioned.
*Interactive Brokers Rated Lowest Cost Broker by StockBrokers.com Annual Online Review 2020
Have feedback on this article? Concerned about the content? Get in touch with us directly. Alternatively, email editorial-team@simplywallst.com.
About TSX:EQB
EQB
Through its subsidiary, Equitable Bank, provides personal and commercial banking services to retail and commercial customers in Canada.
High growth potential established dividend payer.
Similar Companies
Market Insights

Weekly Picks

Early mover in a fast growing industry. Likely to experience share price volatility as they scale


A case for CA$31.80 (undiluted), aka 8,616% upside from CA$0.37 (an 86 bagger!).


Moderation and Stabilisation: HOLD: Fair Price based on a 4-year Cycle is $12.08
Recently Updated Narratives

Airbnb Stock: Platform Growth in a World of Saturation and Scrutiny

Adobe Stock: AI-Fueled ARR Growth Pushes Guidance Higher, But Cost Pressures Loom

Thomson Reuters Stock: When Legal Intelligence Becomes Mission-Critical Infrastructure
Popular Narratives


Crazy Undervalued 42 Baggers Silver Play (Active & Running Mine)


NVDA: Expanding AI Demand Will Drive Major Data Center Investments Through 2026

The AI Infrastructure Giant Grows Into Its Valuation
Trending Discussion


