- Canada
- /
- Auto Components
- /
- TSX:LNR
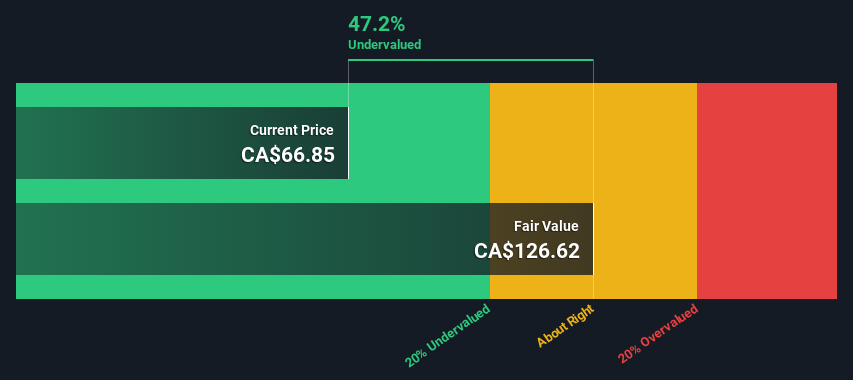
Linamar Corporation's (TSE:LNR) Intrinsic Value Is Potentially 89% Above Its Share Price

Key Insights
- The projected fair value for Linamar is CA$127 based on 2 Stage Free Cash Flow to Equity
- Current share price of CA$66.85 suggests Linamar is potentially 47% undervalued
- Analyst price target for LNR is CA$89.33 which is 29% below our fair value estimate
Today we will run through one way of estimating the intrinsic value of Linamar Corporation (TSE:LNR) by estimating the company's future cash flows and discounting them to their present value. This will be done using the Discounted Cash Flow (DCF) model. Don't get put off by the jargon, the math behind it is actually quite straightforward.
Remember though, that there are many ways to estimate a company's value, and a DCF is just one method. If you still have some burning questions about this type of valuation, take a look at the Simply Wall St analysis model.
Check out our latest analysis for Linamar
Step By Step Through The Calculation
We are going to use a two-stage DCF model, which, as the name states, takes into account two stages of growth. The first stage is generally a higher growth period which levels off heading towards the terminal value, captured in the second 'steady growth' period. To begin with, we have to get estimates of the next ten years of cash flows. Where possible we use analyst estimates, but when these aren't available we extrapolate the previous free cash flow (FCF) from the last estimate or reported value. We assume companies with shrinking free cash flow will slow their rate of shrinkage, and that companies with growing free cash flow will see their growth rate slow, over this period. We do this to reflect that growth tends to slow more in the early years than it does in later years.
A DCF is all about the idea that a dollar in the future is less valuable than a dollar today, so we discount the value of these future cash flows to their estimated value in today's dollars:
10-year free cash flow (FCF) estimate
| 2024 | 2025 | 2026 | 2027 | 2028 | 2029 | 2030 | 2031 | 2032 | 2033 | |
| Levered FCF (CA$, Millions) | CA$317.4m | CA$449.0m | CA$516.0m | CA$572.7m | CA$620.0m | CA$659.3m | CA$692.3m | CA$720.3m | CA$744.8m | CA$766.7m |
| Growth Rate Estimate Source | Analyst x3 | Analyst x1 | Est @ 14.92% | Est @ 11.00% | Est @ 8.26% | Est @ 6.34% | Est @ 4.99% | Est @ 4.05% | Est @ 3.40% | Est @ 2.94% |
| Present Value (CA$, Millions) Discounted @ 9.4% | CA$290 | CA$375 | CA$394 | CA$399 | CA$395 | CA$384 | CA$368 | CA$350 | CA$331 | CA$311 |
("Est" = FCF growth rate estimated by Simply Wall St)
Present Value of 10-year Cash Flow (PVCF) = CA$3.6b
We now need to calculate the Terminal Value, which accounts for all the future cash flows after this ten year period. The Gordon Growth formula is used to calculate Terminal Value at a future annual growth rate equal to the 5-year average of the 10-year government bond yield of 1.9%. We discount the terminal cash flows to today's value at a cost of equity of 9.4%.
Terminal Value (TV)= FCF2033 × (1 + g) ÷ (r – g) = CA$767m× (1 + 1.9%) ÷ (9.4%– 1.9%) = CA$10b
Present Value of Terminal Value (PVTV)= TV / (1 + r)10= CA$10b÷ ( 1 + 9.4%)10= CA$4.2b
The total value, or equity value, is then the sum of the present value of the future cash flows, which in this case is CA$7.8b. The last step is to then divide the equity value by the number of shares outstanding. Compared to the current share price of CA$66.9, the company appears quite undervalued at a 47% discount to where the stock price trades currently. The assumptions in any calculation have a big impact on the valuation, so it is better to view this as a rough estimate, not precise down to the last cent.
Important Assumptions
The calculation above is very dependent on two assumptions. The first is the discount rate and the other is the cash flows. You don't have to agree with these inputs, I recommend redoing the calculations yourself and playing with them. The DCF also does not consider the possible cyclicality of an industry, or a company's future capital requirements, so it does not give a full picture of a company's potential performance. Given that we are looking at Linamar as potential shareholders, the cost of equity is used as the discount rate, rather than the cost of capital (or weighted average cost of capital, WACC) which accounts for debt. In this calculation we've used 9.4%, which is based on a levered beta of 1.513. Beta is a measure of a stock's volatility, compared to the market as a whole. We get our beta from the industry average beta of globally comparable companies, with an imposed limit between 0.8 and 2.0, which is a reasonable range for a stable business.
SWOT Analysis for Linamar
- Earnings growth over the past year exceeded its 5-year average.
- Debt is not viewed as a risk.
- Dividends are covered by earnings and cash flows.
- Earnings growth over the past year underperformed the Auto Components industry.
- Dividend is low compared to the top 25% of dividend payers in the Auto Components market.
- Annual revenue is forecast to grow faster than the Canadian market.
- Trading below our estimate of fair value by more than 20%.
- Annual earnings have declined over the past 5 years.
Moving On:
Whilst important, the DCF calculation is only one of many factors that you need to assess for a company. DCF models are not the be-all and end-all of investment valuation. Preferably you'd apply different cases and assumptions and see how they would impact the company's valuation. For example, changes in the company's cost of equity or the risk free rate can significantly impact the valuation. Why is the intrinsic value higher than the current share price? For Linamar, there are three essential elements you should explore:
- Risks: Every company has them, and we've spotted 1 warning sign for Linamar you should know about.
- Management:Have insiders been ramping up their shares to take advantage of the market's sentiment for LNR's future outlook? Check out our management and board analysis with insights on CEO compensation and governance factors.
- Other High Quality Alternatives: Do you like a good all-rounder? Explore our interactive list of high quality stocks to get an idea of what else is out there you may be missing!
PS. Simply Wall St updates its DCF calculation for every Canadian stock every day, so if you want to find the intrinsic value of any other stock just search here.
Mobile Infrastructure for Defense and Disaster
The next wave in robotics isn't humanoid. Its fully autonomous towers delivering 5G, ISR, and radar in under 30 minutes, anywhere.
Get the investor briefing before the next round of contracts
Sponsored On Behalf of CiTechNew: AI Stock Screener & Alerts
Our new AI Stock Screener scans the market every day to uncover opportunities.
• Dividend Powerhouses (3%+ Yield)
• Undervalued Small Caps with Insider Buying
• High growth Tech and AI Companies
Or build your own from over 50 metrics.
Have feedback on this article? Concerned about the content? Get in touch with us directly. Alternatively, email editorial-team (at) simplywallst.com.
This article by Simply Wall St is general in nature. We provide commentary based on historical data and analyst forecasts only using an unbiased methodology and our articles are not intended to be financial advice. It does not constitute a recommendation to buy or sell any stock, and does not take account of your objectives, or your financial situation. We aim to bring you long-term focused analysis driven by fundamental data. Note that our analysis may not factor in the latest price-sensitive company announcements or qualitative material. Simply Wall St has no position in any stocks mentioned.
About TSX:LNR
Linamar
Manufactures and sells engineered products in Canada, Europe, the Asia Pacific, and rest of North America.
Flawless balance sheet second-rate dividend payer.
Similar Companies
Market Insights

Weekly Picks

Early mover in a fast growing industry. Likely to experience share price volatility as they scale


A case for CA$31.80 (undiluted), aka 8,616% upside from CA$0.37 (an 86 bagger!).


Moderation and Stabilisation: HOLD: Fair Price based on a 4-year Cycle is $12.08
Recently Updated Narratives


Title: Market Sentiment Is Dead Wrong — Here's Why PSEC Deserves a Second Look


An amazing opportunity to potentially get a 100 bagger

Amazon: Why the World’s Biggest Platform Still Runs on Invisible Economics
Popular Narratives


Crazy Undervalued 42 Baggers Silver Play (Active & Running Mine)


MicroVision will explode future revenue by 380.37% with a vision towards success


NVDA: Expanding AI Demand Will Drive Major Data Center Investments Through 2026
Trending Discussion
