
Advertisement
- Belgium
- /
- Electronic Equipment and Components
- /
- ENXTBR:PAY
Is Payton Planar Magnetics Ltd.'s (EBR:PAY) Recent Stock Performance Tethered To Its Strong Fundamentals?

Payton Planar Magnetics' (EBR:PAY) stock is up by a considerable 11% over the past week. Since the market usually pay for a company’s long-term fundamentals, we decided to study the company’s key performance indicators to see if they could be influencing the market. Specifically, we decided to study Payton Planar Magnetics' ROE in this article.
Return on equity or ROE is a key measure used to assess how efficiently a company's management is utilizing the company's capital. Put another way, it reveals the company's success at turning shareholder investments into profits.
Check out our latest analysis for Payton Planar Magnetics
How To Calculate Return On Equity?
The formula for ROE is:
Return on Equity = Net Profit (from continuing operations) ÷ Shareholders' Equity
So, based on the above formula, the ROE for Payton Planar Magnetics is:
23% = US$17m ÷ US$73m (Based on the trailing twelve months to June 2024).
The 'return' is the amount earned after tax over the last twelve months. That means that for every €1 worth of shareholders' equity, the company generated €0.23 in profit.
Why Is ROE Important For Earnings Growth?
Thus far, we have learned that ROE measures how efficiently a company is generating its profits. Based on how much of its profits the company chooses to reinvest or "retain", we are then able to evaluate a company's future ability to generate profits. Assuming everything else remains unchanged, the higher the ROE and profit retention, the higher the growth rate of a company compared to companies that don't necessarily bear these characteristics.
Payton Planar Magnetics' Earnings Growth And 23% ROE
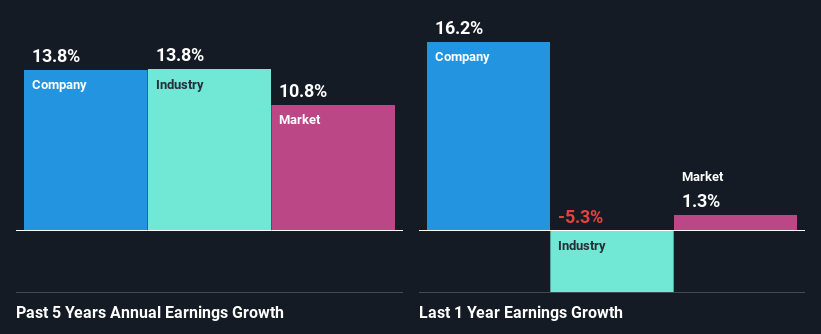
First thing first, we like that Payton Planar Magnetics has an impressive ROE. Additionally, the company's ROE is higher compared to the industry average of 11% which is quite remarkable. Probably as a result of this, Payton Planar Magnetics was able to see a decent net income growth of 14% over the last five years.
As a next step, we compared Payton Planar Magnetics' net income growth with the industry and found that the company has a similar growth figure when compared with the industry average growth rate of 14% in the same period.
The basis for attaching value to a company is, to a great extent, tied to its earnings growth. It’s important for an investor to know whether the market has priced in the company's expected earnings growth (or decline). This then helps them determine if the stock is placed for a bright or bleak future. If you're wondering about Payton Planar Magnetics''s valuation, check out this gauge of its price-to-earnings ratio, as compared to its industry.
Is Payton Planar Magnetics Using Its Retained Earnings Effectively?
Payton Planar Magnetics has a significant three-year median payout ratio of 61%, meaning that it is left with only 39% to reinvest into its business. This implies that the company has been able to achieve decent earnings growth despite returning most of its profits to shareholders.
Besides, Payton Planar Magnetics has been paying dividends over a period of nine years. This shows that the company is committed to sharing profits with its shareholders.
Summary
Overall, we are quite pleased with Payton Planar Magnetics' performance. Especially the high ROE, Which has contributed to the impressive growth seen in earnings. Despite the company reinvesting only a small portion of its profits, it still has managed to grow its earnings so that is appreciable. Up till now, we've only made a short study of the company's growth data. To gain further insights into Payton Planar Magnetics' past profit growth, check out this visualization of past earnings, revenue and cash flows.
New: Manage All Your Stock Portfolios in One Place
We've created the ultimate portfolio companion for stock investors, and it's free.
• Connect an unlimited number of Portfolios and see your total in one currency
• Be alerted to new Warning Signs or Risks via email or mobile
• Track the Fair Value of your stocks
Have feedback on this article? Concerned about the content? Get in touch with us directly. Alternatively, email editorial-team (at) simplywallst.com.
This article by Simply Wall St is general in nature. We provide commentary based on historical data and analyst forecasts only using an unbiased methodology and our articles are not intended to be financial advice. It does not constitute a recommendation to buy or sell any stock, and does not take account of your objectives, or your financial situation. We aim to bring you long-term focused analysis driven by fundamental data. Note that our analysis may not factor in the latest price-sensitive company announcements or qualitative material. Simply Wall St has no position in any stocks mentioned.
About ENXTBR:PAY
Payton Planar Magnetics
Develops, manufactures, and markets planar and conventional transformers worldwide.
Flawless balance sheet average dividend payer.
Market Insights


Advertisement
Community Narratives
The Future of Drug Testing? Fingerprint Tech Shows Serious Promise
Fair Value US$2.98|40.3% undervalued
JO
Community Contributor
Suncorp’s Next Chapter: Insurance-Only and Ready to Grow
Fair Value AU$22.83|7.9% undervalued
RO
Community Contributor
Thyssenkrupp Nucera Will Achieve Double-Digit Profits by 2030 Boosted by Hydrogen Growth
Fair Value €14.40|31.6% undervalued
CH
Community Contributor
Tesla’s Nvidia Moment – The AI & Robotics Inflection Point
Fair Value US$359.72|12.3% undervalued
BL
Community Contributor