
Advertisement
DMS Imaging SA (EBR:ALIMG) Soars 29% But It's A Story Of Risk Vs Reward

Despite an already strong run, DMS Imaging SA (EBR:ALIMG) shares have been powering on, with a gain of 29% in the last thirty days. But the last month did very little to improve the 70% share price decline over the last year.
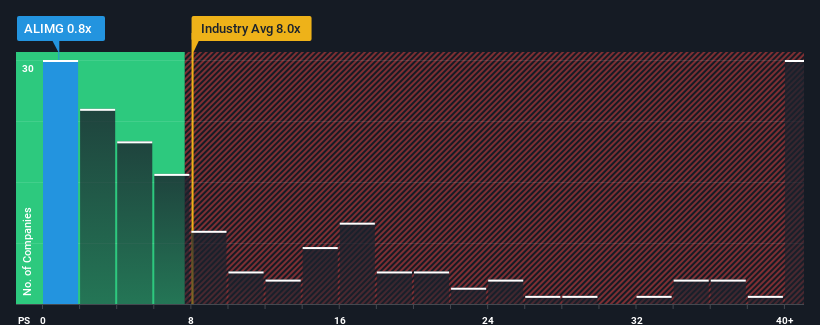
Even after such a large jump in price, DMS Imaging's price-to-sales (or "P/S") ratio of 0.8x might still make it look like a strong buy right now compared to the wider Biotechs industry in Belgium, where around half of the companies have P/S ratios above 8x and even P/S above 33x are quite common. Nonetheless, we'd need to dig a little deeper to determine if there is a rational basis for the highly reduced P/S.
Check out our latest analysis for DMS Imaging
How DMS Imaging Has Been Performing
Recent times have been quite advantageous for DMS Imaging as its revenue has been rising very briskly. It might be that many expect the strong revenue performance to degrade substantially, which has repressed the P/S ratio. If you like the company, you'd be hoping this isn't the case so that you could potentially pick up some stock while it's out of favour.
Want the full picture on earnings, revenue and cash flow for the company? Then our free report on DMS Imaging will help you shine a light on its historical performance.Do Revenue Forecasts Match The Low P/S Ratio?
There's an inherent assumption that a company should far underperform the industry for P/S ratios like DMS Imaging's to be considered reasonable.
If we review the last year of revenue growth, the company posted a terrific increase of 109%. Spectacularly, three year revenue growth has ballooned by several orders of magnitude, thanks in part to the last 12 months of revenue growth. So we can start by confirming that the company has done a tremendous job of growing revenue over that time.
This is in contrast to the rest of the industry, which is expected to grow by 123% over the next year, materially lower than the company's recent medium-term annualised growth rates.
With this in mind, we find it intriguing that DMS Imaging's P/S isn't as high compared to that of its industry peers. Apparently some shareholders believe the recent performance has exceeded its limits and have been accepting significantly lower selling prices.
What Does DMS Imaging's P/S Mean For Investors?
DMS Imaging's recent share price jump still sees fails to bring its P/S alongside the industry median. Using the price-to-sales ratio alone to determine if you should sell your stock isn't sensible, however it can be a practical guide to the company's future prospects.
Our examination of DMS Imaging revealed its three-year revenue trends aren't boosting its P/S anywhere near as much as we would have predicted, given they look better than current industry expectations. When we see strong revenue with faster-than-industry growth, we assume there are some significant underlying risks to the company's ability to make money which is applying downwards pressure on the P/S ratio. It appears many are indeed anticipating revenue instability, because the persistence of these recent medium-term conditions would normally provide a boost to the share price.
Having said that, be aware DMS Imaging is showing 2 warning signs in our investment analysis, and 1 of those doesn't sit too well with us.
If these risks are making you reconsider your opinion on DMS Imaging, explore our interactive list of high quality stocks to get an idea of what else is out there.
Valuation is complex, but we're here to simplify it.
Discover if European Medical Solutions might be undervalued or overvalued with our detailed analysis, featuring fair value estimates, potential risks, dividends, insider trades, and its financial condition.
Access Free AnalysisHave feedback on this article? Concerned about the content? Get in touch with us directly. Alternatively, email editorial-team (at) simplywallst.com.
This article by Simply Wall St is general in nature. We provide commentary based on historical data and analyst forecasts only using an unbiased methodology and our articles are not intended to be financial advice. It does not constitute a recommendation to buy or sell any stock, and does not take account of your objectives, or your financial situation. We aim to bring you long-term focused analysis driven by fundamental data. Note that our analysis may not factor in the latest price-sensitive company announcements or qualitative material. Simply Wall St has no position in any stocks mentioned.
About ENXTBR:ALEMS
European Medical Solutions
Engages in the design, development, and manufacturing of medical imaging systems for digital radiology and bone densitometry in Belgium.
Acceptable track record with mediocre balance sheet.
Market Insights


Advertisement
Community Narratives
The Future of Drug Testing? Fingerprint Tech Shows Serious Promise
Fair Value US$2.98|40.3% undervalued
JO
Community Contributor
Suncorp’s Next Chapter: Insurance-Only and Ready to Grow
Fair Value AU$22.83|7.6% undervalued
RO
Community Contributor
Thyssenkrupp Nucera Will Achieve Double-Digit Profits by 2030 Boosted by Hydrogen Growth
Fair Value €14.40|31.6% undervalued
CH
Community Contributor
Tesla’s Nvidia Moment – The AI & Robotics Inflection Point
Fair Value US$359.72|12.3% undervalued
BL
Community Contributor