
Advertisement

Amidst a backdrop of renewed uncertainty about U.S. trade policy and escalating geopolitical tensions in the Middle East, European markets have seen declines, with the pan-European STOXX Europe 600 Index ending 1.57% lower and major stock indexes such as Germany’s DAX and Italy’s FTSE MIB experiencing notable drops. In this environment, identifying high-growth tech stocks requires a focus on companies demonstrating resilience through innovation and adaptability to shifting economic landscapes, making them compelling options to watch in Europe's tech sector.
Top 10 High Growth Tech Companies In Europe
| Name | Revenue Growth | Earnings Growth | Growth Rating |
|---|---|---|---|
| Intellego Technologies | 30.80% | 45.66% | ★★★★★★ |
| Archos | 21.07% | 36.58% | ★★★★★★ |
| KebNi | 21.51% | 66.96% | ★★★★★★ |
| Pharma Mar | 29.61% | 44.92% | ★★★★★★ |
| Bonesupport Holding | 29.17% | 58.57% | ★★★★★★ |
| argenx | 21.76% | 26.84% | ★★★★★★ |
| Skolon | 31.51% | 99.52% | ★★★★★★ |
| Xbrane Biopharma | 24.95% | 56.77% | ★★★★★★ |
| Diamyd Medical | 86.29% | 93.04% | ★★★★★★ |
| Elliptic Laboratories | 36.33% | 78.99% | ★★★★★★ |
We're going to check out a few of the best picks from our screener tool.
Digital Value (BIT:DGV)
Simply Wall St Growth Rating: ★★★★☆☆
Overview: Digital Value S.p.A. offers IT solutions and services in Italy, with a market capitalization of €312.04 million.
Operations: The company generates revenue through providing IT solutions and services within Italy. With a market capitalization of €312.04 million, its business operations focus on delivering technological expertise to various sectors.
Despite a slight dip in revenues and net income as reported in its latest financial results, Digital Value's strategic positioning within the tech sector remains robust, marked by a notable annual revenue growth rate of 23.9% and earnings growth of 17.5%. This performance starkly outpaces the general market trends in Italy, where average revenue and earnings growth rates hover around 4.1% and 7.3%, respectively. The company's commitment to innovation is evident from its recent R&D investments that align with industry demands for evolving technology solutions, ensuring Digital Value stays relevant in a competitive landscape. With earnings growing at nearly four times the national average, coupled with a proactive approach to adapting market changes, Digital Value appears poised for continued relevance despite current fiscal pressures.
- Unlock comprehensive insights into our analysis of Digital Value stock in this health report.
Explore historical data to track Digital Value's performance over time in our Past section.
Kinepolis Group (ENXTBR:KIN)
Simply Wall St Growth Rating: ★★★★☆☆
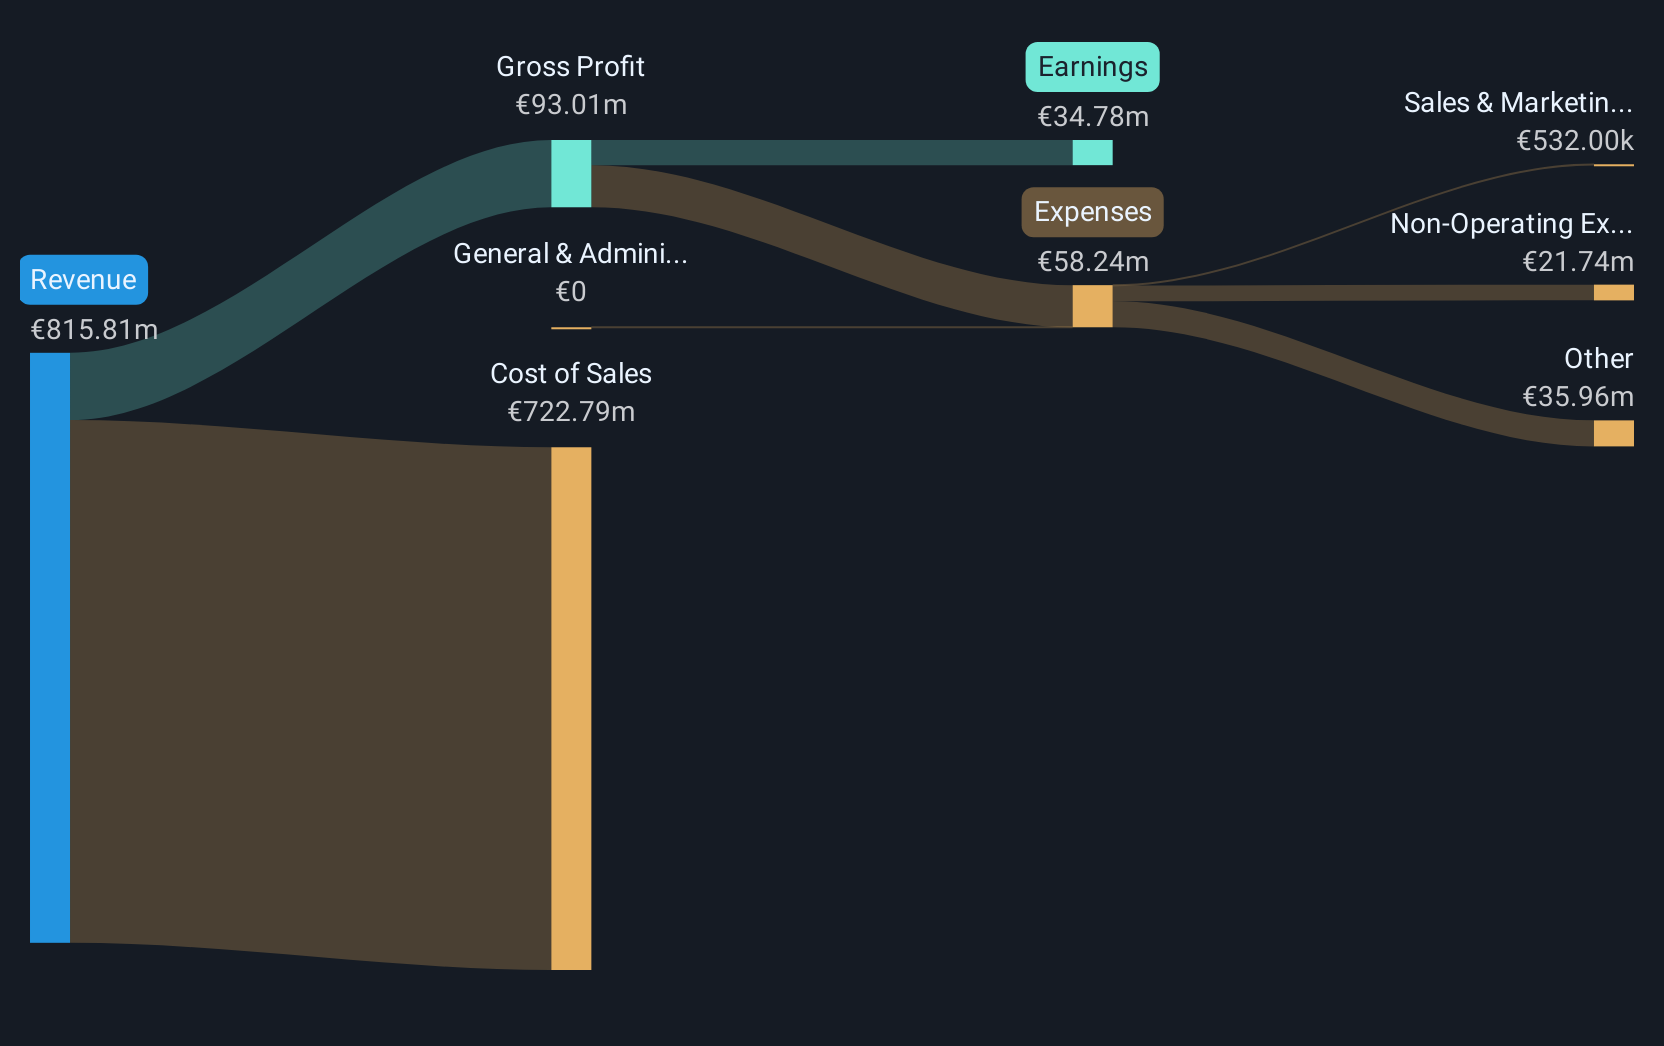
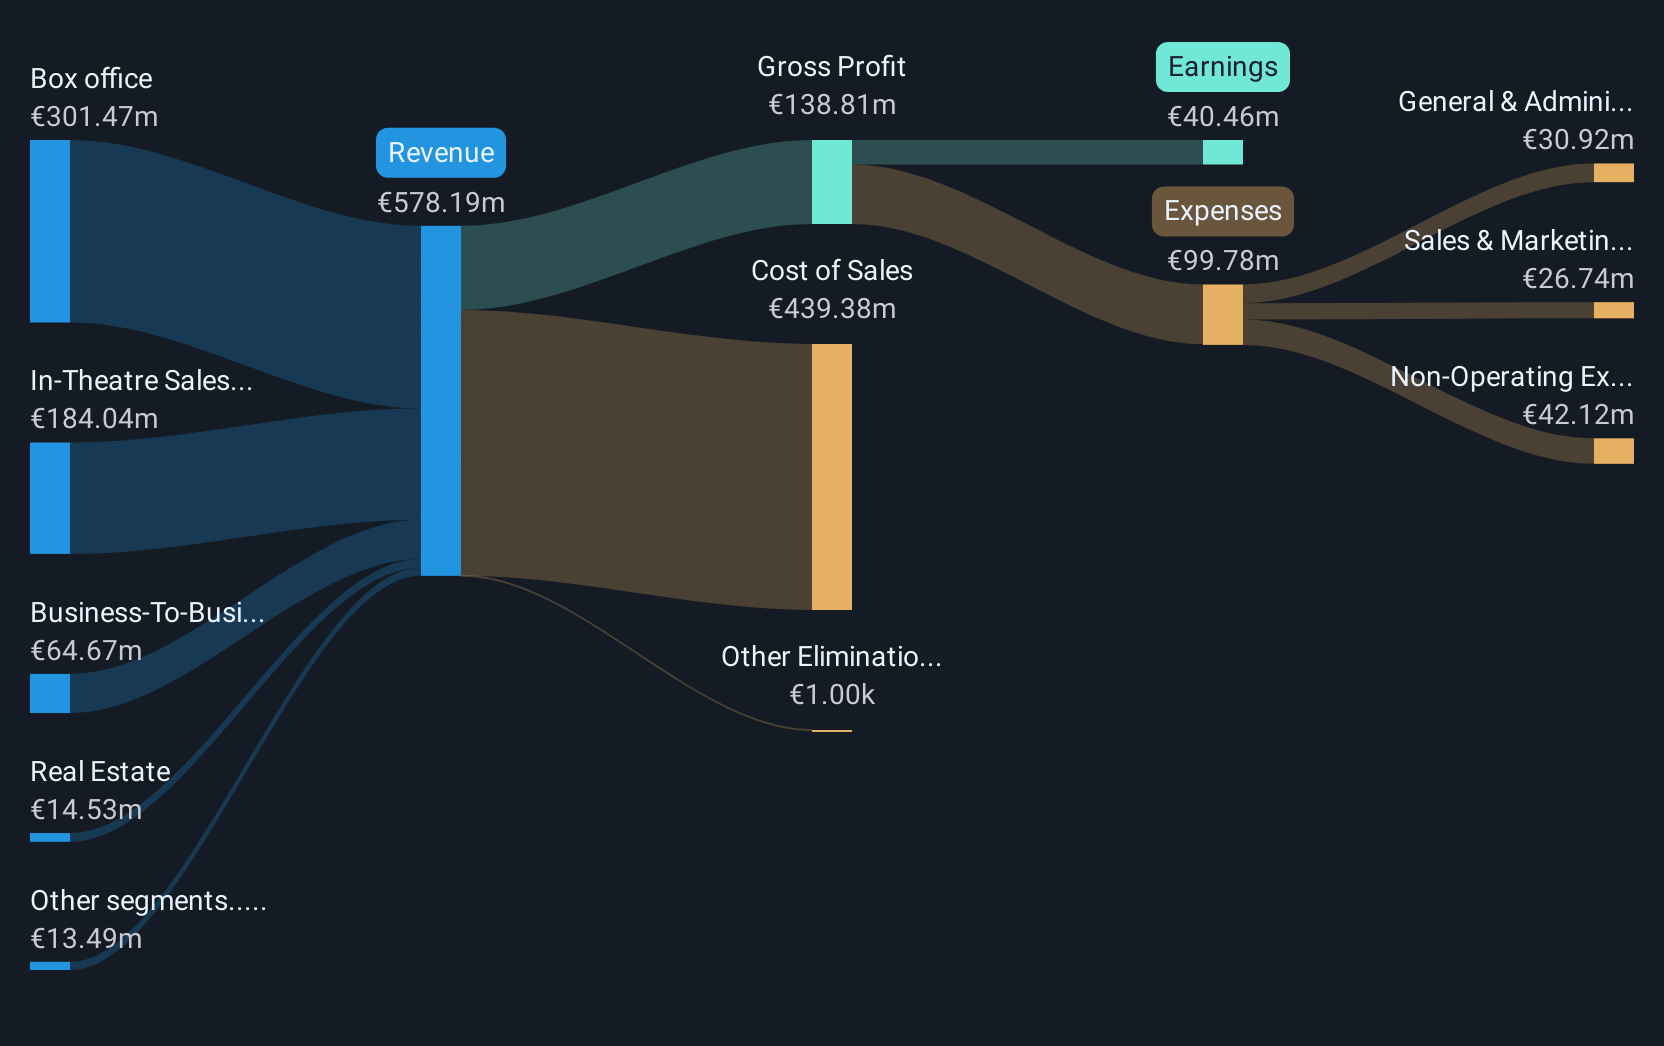
Overview: Kinepolis Group NV operates cinema complexes across several countries, including Belgium, the Netherlands, France, Spain, Luxembourg, Switzerland, Poland, Canada, and the United States with a market cap of €956.26 million.
Operations: Kinepolis Group generates revenue primarily from box office sales (€301.47 million) and in-theatre sales (€184.04 million), supplemented by business-to-business services (€64.67 million) and real estate activities (€14.53 million).
Kinepolis Group, despite a recent downturn in sales and net income, remains poised for significant earnings growth, with projections indicating an annual increase of 21.8%. This anticipated growth starkly contrasts with a broader Belgian market expectation of 14.1%, underscoring the company's robust potential amidst challenging conditions. The firm's strategic focus on high-quality earnings and a promising return on equity forecasted at 23.8% further solidifies its standing in the competitive entertainment landscape. With revenue growth slightly lagging behind market trends at 4.6% annually compared to Belgium's average of 6.9%, Kinepolis must leverage its strong financial management and innovative strategies to enhance performance and capitalize on future opportunities.
- Click here and access our complete health analysis report to understand the dynamics of Kinepolis Group.
Gain insights into Kinepolis Group's past trends and performance with our Past report.
LINK Mobility Group Holding (OB:LINK)
Simply Wall St Growth Rating: ★★★★☆☆
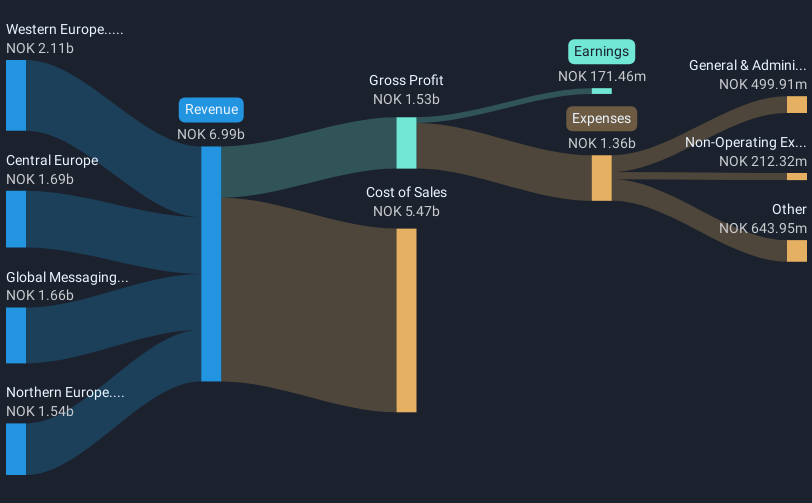
Overview: LINK Mobility Group Holding ASA, with a market cap of NOK7.52 billion, offers mobile and communication-platform-as-a-service solutions through its subsidiaries.
Operations: The company generates revenue primarily from four segments: Central Europe (NOK 1.73 billion), Western Europe (NOK 2.14 billion), Northern Europe (NOK 1.55 billion), and Global Messaging (NOK 1.55 billion).
Despite facing a substantial one-off loss of NOK 80.9 million, LINK Mobility Group Holding ASA demonstrates robust growth potential with its revenue and earnings outpacing the Norwegian market. The company's revenue is growing at an annual rate of 8.9%, significantly faster than the market's 2.6%. Additionally, LINK has achieved a remarkable 61% earnings growth over the past year, far exceeding the software industry average of 17.2%. This performance is supported by strategic initiatives including recent debt financing activities and aggressive share repurchases totaling NOK 190.4 million for about 2.99% of outstanding shares since mid-2024, positioning it well for sustained future growth in a competitive tech landscape.
Key Takeaways
- Click here to access our complete index of 223 European High Growth Tech and AI Stocks.
- Have you diversified into these companies? Leverage the power of Simply Wall St's portfolio to keep a close eye on market movements affecting your investments.
- Elevate your portfolio with Simply Wall St, the ultimate app for investors seeking global market coverage.
Seeking Other Investments?
- Explore high-performing small cap companies that haven't yet garnered significant analyst attention.
- Fuel your portfolio with companies showing strong growth potential, backed by optimistic outlooks both from analysts and management.
- Find companies with promising cash flow potential yet trading below their fair value.
This article by Simply Wall St is general in nature. We provide commentary based on historical data and analyst forecasts only using an unbiased methodology and our articles are not intended to be financial advice. It does not constitute a recommendation to buy or sell any stock, and does not take account of your objectives, or your financial situation. We aim to bring you long-term focused analysis driven by fundamental data. Note that our analysis may not factor in the latest price-sensitive company announcements or qualitative material. Simply Wall St has no position in any stocks mentioned.
New: AI Stock Screener & Alerts
Our new AI Stock Screener scans the market every day to uncover opportunities.
• Dividend Powerhouses (3%+ Yield)
• Undervalued Small Caps with Insider Buying
• High growth Tech and AI Companies
Or build your own from over 50 metrics.
Have feedback on this article? Concerned about the content? Get in touch with us directly. Alternatively, email editorial-team@simplywallst.com
About OB:LINK
LINK Mobility Group Holding
Provides mobile and communication-platform-as-a-service solutions.
Excellent balance sheet with reasonable growth potential.
Similar Companies
Market Insights

Advertisement
Community Narratives
Vita Life Sciences Set for a 12.72% Revenue Growth While Tackling Operational Challenges
Fair Value AU$2.42|12.0% undervalued
RO
Community Contributor
Vossloh rides a €500 billion wave to boost growth and earnings in the next decade
Fair Value €78.41|5.2% undervalued
CH
Community Contributor
Intuitive Surgical Will Transform Healthcare with 12% Revenue Growth
Fair Value US$325.55|57.3% overvalued
UN
Community Contributor