- Belgium
- /
- Medical Equipment
- /
- ENXTBR:IBAB
Further Upside For Ion Beam Applications SA (EBR:IBAB) Shares Could Introduce Price Risks After 29% Bounce

Ion Beam Applications SA (EBR:IBAB) shareholders would be excited to see that the share price has had a great month, posting a 29% gain and recovering from prior weakness. Not all shareholders will be feeling jubilant, since the share price is still down a very disappointing 20% in the last twelve months.
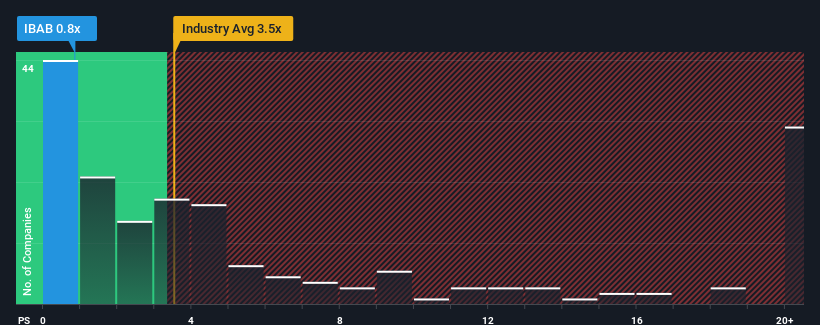
In spite of the firm bounce in price, Ion Beam Applications may still be sending very bullish signals at the moment with its price-to-sales (or "P/S") ratio of 0.8x, since almost half of all companies in the Medical Equipment industry in Belgium have P/S ratios greater than 3.5x and even P/S higher than 10x are not unusual. Although, it's not wise to just take the P/S at face value as there may be an explanation why it's so limited.
See our latest analysis for Ion Beam Applications
What Does Ion Beam Applications' P/S Mean For Shareholders?
Ion Beam Applications certainly has been doing a good job lately as it's been growing revenue more than most other companies. It might be that many expect the strong revenue performance to degrade substantially, which has repressed the share price, and thus the P/S ratio. If the company manages to stay the course, then investors should be rewarded with a share price that matches its revenue figures.
Want the full picture on analyst estimates for the company? Then our free report on Ion Beam Applications will help you uncover what's on the horizon.How Is Ion Beam Applications' Revenue Growth Trending?
The only time you'd be truly comfortable seeing a P/S as depressed as Ion Beam Applications' is when the company's growth is on track to lag the industry decidedly.
Taking a look back first, we see that the company grew revenue by an impressive 19% last year. The strong recent performance means it was also able to grow revenue by 37% in total over the last three years. Accordingly, shareholders would have definitely welcomed those medium-term rates of revenue growth.
Looking ahead now, revenue is anticipated to climb by 13% per annum during the coming three years according to the three analysts following the company. With the industry only predicted to deliver 9.3% per annum, the company is positioned for a stronger revenue result.
With this in consideration, we find it intriguing that Ion Beam Applications' P/S sits behind most of its industry peers. Apparently some shareholders are doubtful of the forecasts and have been accepting significantly lower selling prices.
The Key Takeaway
Shares in Ion Beam Applications have risen appreciably however, its P/S is still subdued. Typically, we'd caution against reading too much into price-to-sales ratios when settling on investment decisions, though it can reveal plenty about what other market participants think about the company.
Ion Beam Applications' analyst forecasts revealed that its superior revenue outlook isn't contributing to its P/S anywhere near as much as we would have predicted. There could be some major risk factors that are placing downward pressure on the P/S ratio. While the possibility of the share price plunging seems unlikely due to the high growth forecasted for the company, the market does appear to have some hesitation.
Before you settle on your opinion, we've discovered 1 warning sign for Ion Beam Applications that you should be aware of.
If you're unsure about the strength of Ion Beam Applications' business, why not explore our interactive list of stocks with solid business fundamentals for some other companies you may have missed.
The New Payments ETF Is Live on NASDAQ:
Money is moving to real-time rails, and a newly listed ETF now gives investors direct exposure. Fast settlement. Institutional custody. Simple access.
Explore how this launch could reshape portfolios
Sponsored ContentNew: AI Stock Screener & Alerts
Our new AI Stock Screener scans the market every day to uncover opportunities.
• Dividend Powerhouses (3%+ Yield)
• Undervalued Small Caps with Insider Buying
• High growth Tech and AI Companies
Or build your own from over 50 metrics.
Have feedback on this article? Concerned about the content? Get in touch with us directly. Alternatively, email editorial-team (at) simplywallst.com.
This article by Simply Wall St is general in nature. We provide commentary based on historical data and analyst forecasts only using an unbiased methodology and our articles are not intended to be financial advice. It does not constitute a recommendation to buy or sell any stock, and does not take account of your objectives, or your financial situation. We aim to bring you long-term focused analysis driven by fundamental data. Note that our analysis may not factor in the latest price-sensitive company announcements or qualitative material. Simply Wall St has no position in any stocks mentioned.
About ENXTBR:IBAB
Ion Beam Applications
Designs, produces, and markets solutions for cancer diagnosis and treatments in Belgium, the United States, and internationally.
Very undervalued with adequate balance sheet.
Similar Companies
Market Insights

Weekly Picks

Early mover in a fast growing industry. Likely to experience share price volatility as they scale


A case for CA$31.80 (undiluted), aka 8,616% upside from CA$0.37 (an 86 bagger!).


Moderation and Stabilisation: HOLD: Fair Price based on a 4-year Cycle is $12.08
Recently Updated Narratives


Title: Market Sentiment Is Dead Wrong — Here's Why PSEC Deserves a Second Look


An amazing opportunity to potentially get a 100 bagger

Amazon: Why the World’s Biggest Platform Still Runs on Invisible Economics
Popular Narratives


Crazy Undervalued 42 Baggers Silver Play (Active & Running Mine)


MicroVision will explode future revenue by 380.37% with a vision towards success


NVDA: Expanding AI Demand Will Drive Major Data Center Investments Through 2026
Trending Discussion
